资源加载中... loading...

CT TTM Squeeze Based Quantitative Trading Strategy

Author: ChaoZhang, Date: 2023-11-15 16:06:37
Tags:

img

Overview

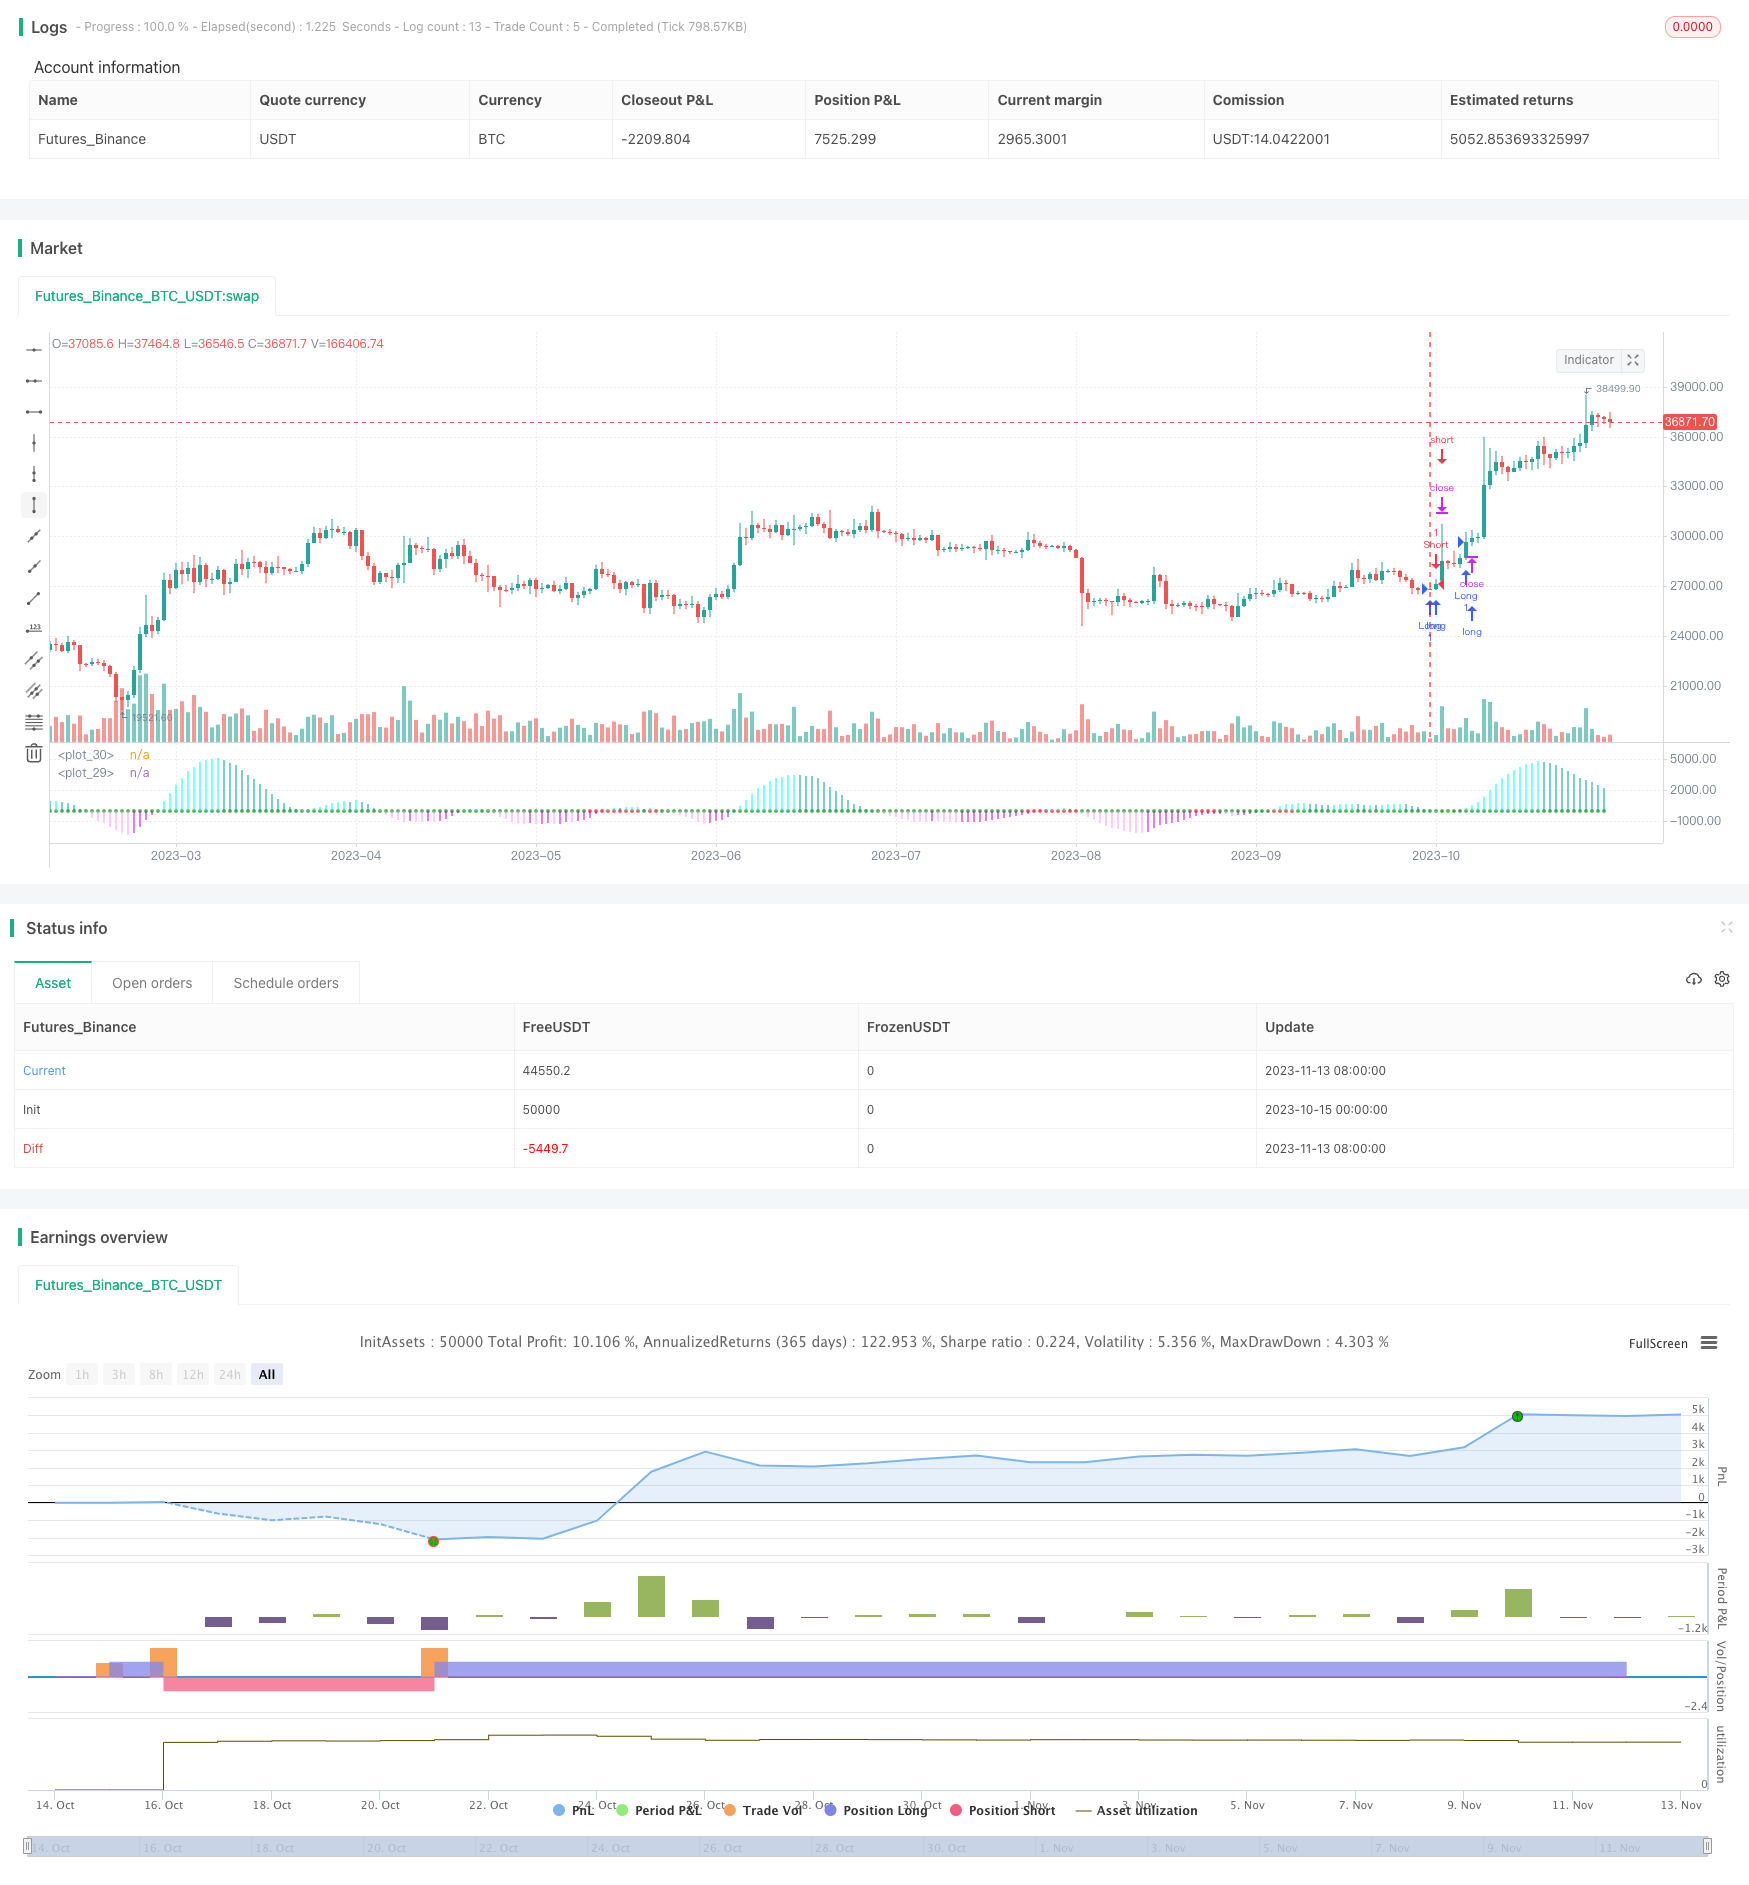
This strategy uses the CT TTM Squeeze indicator to identify price trends and applies trailing stops to control risks. The strategy is named “Trend Following Strategy Based on CT TTM Squeeze”.

Strategy Logic

The strategy utilizes the CT TTM Squeeze indicator to determine price trends. Specifically, the following variables are defined in the strategy:

  • e1 - midpoint of the middle band
  • osc - oscillator calculated from the difference between close price and e1 over a period regressed linearly
  • diff - difference between Bollinger Bands and Keltner Channels
  • osc_color - designate oscillator colors
  • mid_color - designate diff colors

If osc crosses above 0, it displays in green, indicating long; if osc crosses below 0, it displays in red, indicating short.

When osc is positive, go long; when osc is negative, go short.

The strategy uses the oscillator osc to determine trend direction and diff to gauge long/short momentum. When osc crosses above 0, it signals an uptrend, thus going long. When osc crosses below 0, it signals a downtrend, thus going short.

Advantage Analysis

The strategy has the following advantages:

  1. Using CT TTM Squeeze to determine trends has a relatively high accuracy. CT TTM Squeeze comprehensively considers moving averages, Bollinger Bands and Keltner Channels, which can effectively identify price trends.

  2. Applying the oscillator to determine long/short signals avoids false signals in non-trending zones. The oscillator can effectively filter out the impact of small price fluctuations on trading signals.

  3. Trailing stops are used to control risks by limiting losses for each trade. The strategy sets stop loss timely after entry, which allows locking in profits and avoiding excessive losses.

  4. The strategy has few parameters and is easy to optimize. With just the length parameter, it facilitates quick testing to find the optimal parameter combination.

  5. The plotting functions clearly display the signals. Different colors are used to distinguish long/short signals and strength, visually presenting trend judgements.

Risk Analysis

The strategy also has the following risks:

  1. CT TTM Squeeze may generate false signals in certain market conditions, leading to trading losses. It can produce incorrect long/short signals when prices fluctuate violently.

  2. Divergence in the oscillator may result in wrong trading signals. Signals can be incorrect when prices have reversed but the oscillator has not turned.

  3. Overly aggressive trailing stops may cause unnecessary losses. Normal fluctuations may trigger the trailing stop and force exit if the stop level is set too close.

  4. The strategy is suitable for strongly trending products only, not for range-bound markets. Since it mainly trades trends, performance is poor in choppy consolidation markets.

  5. Excessive optimization may lead to curve fitting. Care should be taken to avoid overfitting in parameter optimization.

Optimization Directions

The strategy can be optimized in the following aspects:

  1. Combine multiple indicators for signal accuracy. Other indicators like MACD, KDJ can be added to optimize entry signals.

  2. Add stop loss optimization modules for more intelligent stops. Trailing stop methods like adaptive stops, limit stops can be tested.

  3. Optimize money management by testing fixed fractional, Kelly formula etc. This can improve capital use efficiency while ensuring per trade risk.

  4. Fine tune parameters for specific products to improve adaptiveness. Adjusting parameters based on product characteristics can improve strategy fit.

  5. Add machine learning algorithms for adaptive learning. Using RNN, LSTM etc. can enhance the strategy’s adaptive capability.

Conclusion

This strategy uses CT TTM Squeeze to determine trend direction, oscillator crossing 0 as entry signals, and trailing stops to manage risks. Its advantages lie in high accuracy, easy optimization, but risks like indicator failure, overly tight stops exist. Future improvements can be made through multi-indicator combos, stop optimization, money management etc. to further enhance performance.


/*backtest
start: 2023-10-15 00:00:00
end: 2023-11-14 00:00:00
period: 1d
basePeriod: 1h
exchanges: [{"eid":"Futures_Binance","currency":"BTC_USDT"}]
*/

//@version=2
strategy("CT TTM Squeeze") 
length = input(title="Length",  defval=20, minval=0) 
bband(length, mult) =>
	sma(close, length) + mult * stdev(close, length)
keltner(length, mult) =>
	ema(close, length) + mult * ema(tr, length)
	
	
// Variables
e1 = (highest(high, length) + lowest(low, length)) / 2 + sma(close, length)
osc = linreg(close - e1 / 2, length, 0)
diff = bband(length, 2) - keltner(length, 1)
osc_color = osc[1] < osc[0] ? osc[0] >= 0 ? #00ffff : #cc00cc : osc[0] >= 0 ? #009b9b : #ff9bff
mid_color = diff >= 0 ? green : red

// Strategy

long = osc > 0
short = osc < 0

if long
    strategy.entry("Long", strategy.long)

if short
    strategy.entry("Short", strategy.short) 


plot(osc, color=osc_color, style=histogram, linewidth=2)
plot(0, color=mid_color, style=circles, linewidth=3)

template: strategy.tpl:40:21: executing "strategy.tpl" at <.api.GetStrategyListByName>: wrong number of args for GetStrategyListByName: want 7 got 6