MACD Trend Following Strategy

Overview
This strategy is named the MACD Trend Following Strategy. It is a quantitative strategy that utilizes the MACD indicator to determine price trends and follows the trends to trade. The strategy aims to capture mid-to-long-term trends and adjust positions in a timely manner when trend reversals occur.
Strategy Logic
The strategy uses the MACD indicator to determine price trends. The MACD is a breakout indicator formed by the fast EMA line (12-day) and the slow EMA line (26-day). The difference between these two lines forms the MACD histogram, and the 9-day EMA of the histogram is the MACD signal line. When the MACD line crosses above the signal line, it is a golden cross, indicating an upward trend. When the MACD line crosses below the signal line, it is a dead cross, indicating a downward trend.
The strategy first calculates the MACD line and signal line, then computes the difference delta between the two lines. When delta crosses above 0, a buy signal is generated. When delta crosses below 0, a sell signal is generated. Based on these two signals, the strategy adjusts positions accordingly. To filter out noise, the strategy also introduces an EMA line - valid trade signals are only generated when the price breaks through this EMA line.
Specifically, the strategy logic is:
- Calculate the MACD line, signal line and the difference delta
- Determine if delta crossing above or below 0 signifies a trend reversal
- Compute an EMA line to serve as a filter
- When delta crosses above 0 and price is above EMA, generate buy signal
- When delta crosses below 0 and price is below EMA, generate sell signal
With this design, the strategy is able to follow mid-to-long-term trends and quickly adjust positions when trends reverse. It avoids being misled by short-term market noises.
Advantages
The strategy has the following advantages:
- Use MACD to accurately detect trend reversal points for entry and exit timing
- Adopt EMA filter to avoid interference from short-term market noises
- Only follow mid-to-long-term trends, avoiding whipsaws in ranging markets
- Simple and clear logic, easy to understand and modify the code
- Flexibility in controlling trading frequency by adjusting parameters
- High capital utilization to fully track mid-to-long-term trends
Risks
There are some risks to be mindful of:
- MACD as a trend following indicator can generate false signals in choppy markets
- EMA filter may filter out some valid trading opportunities
- Improper parameter settings may lead to over- or under-trading
- Unable to respond to short-term market changes due to lagging nature
- May miss optimal timing at trend turning points due to lag
Solutions:
- Optimize parameters and adjust EMA filter to reduce false signals
- Incorporate other indicators for confirmation to uncover more trades
- Implement stop loss to control loss on single trades
- Shorten holding period to improve flexibility
Optimization
The strategy can be further optimized in the following ways:
- Add other indicators to form a combined system for higher accuracy
- Introduce profit taking and stop loss mechanisms for better risk control
- Incorporate volume indicators to avoid false breakouts
- Adapt parameters dynamically based on market conditions to improve robustness
- Refine entry and exit logic to improve timing
- Scale in positions to better follow trends and reduce risk
Significant improvement can be achieved through methods like indicator combos, adaptive parameters, stop loss/profit taking etc.
Conclusion
In summary, the MACD Trend Following Strategy utilizes the simple and effective MACD indicator to identify mid-to-long-term trends, and implements a clear trend following logic. It has the capacity to capture trends as well as reasonable risk control measures. With further optimizations, the strategy can become a very practical quant trading system. It suits investors seeking steady long-term gains over short-term profits.
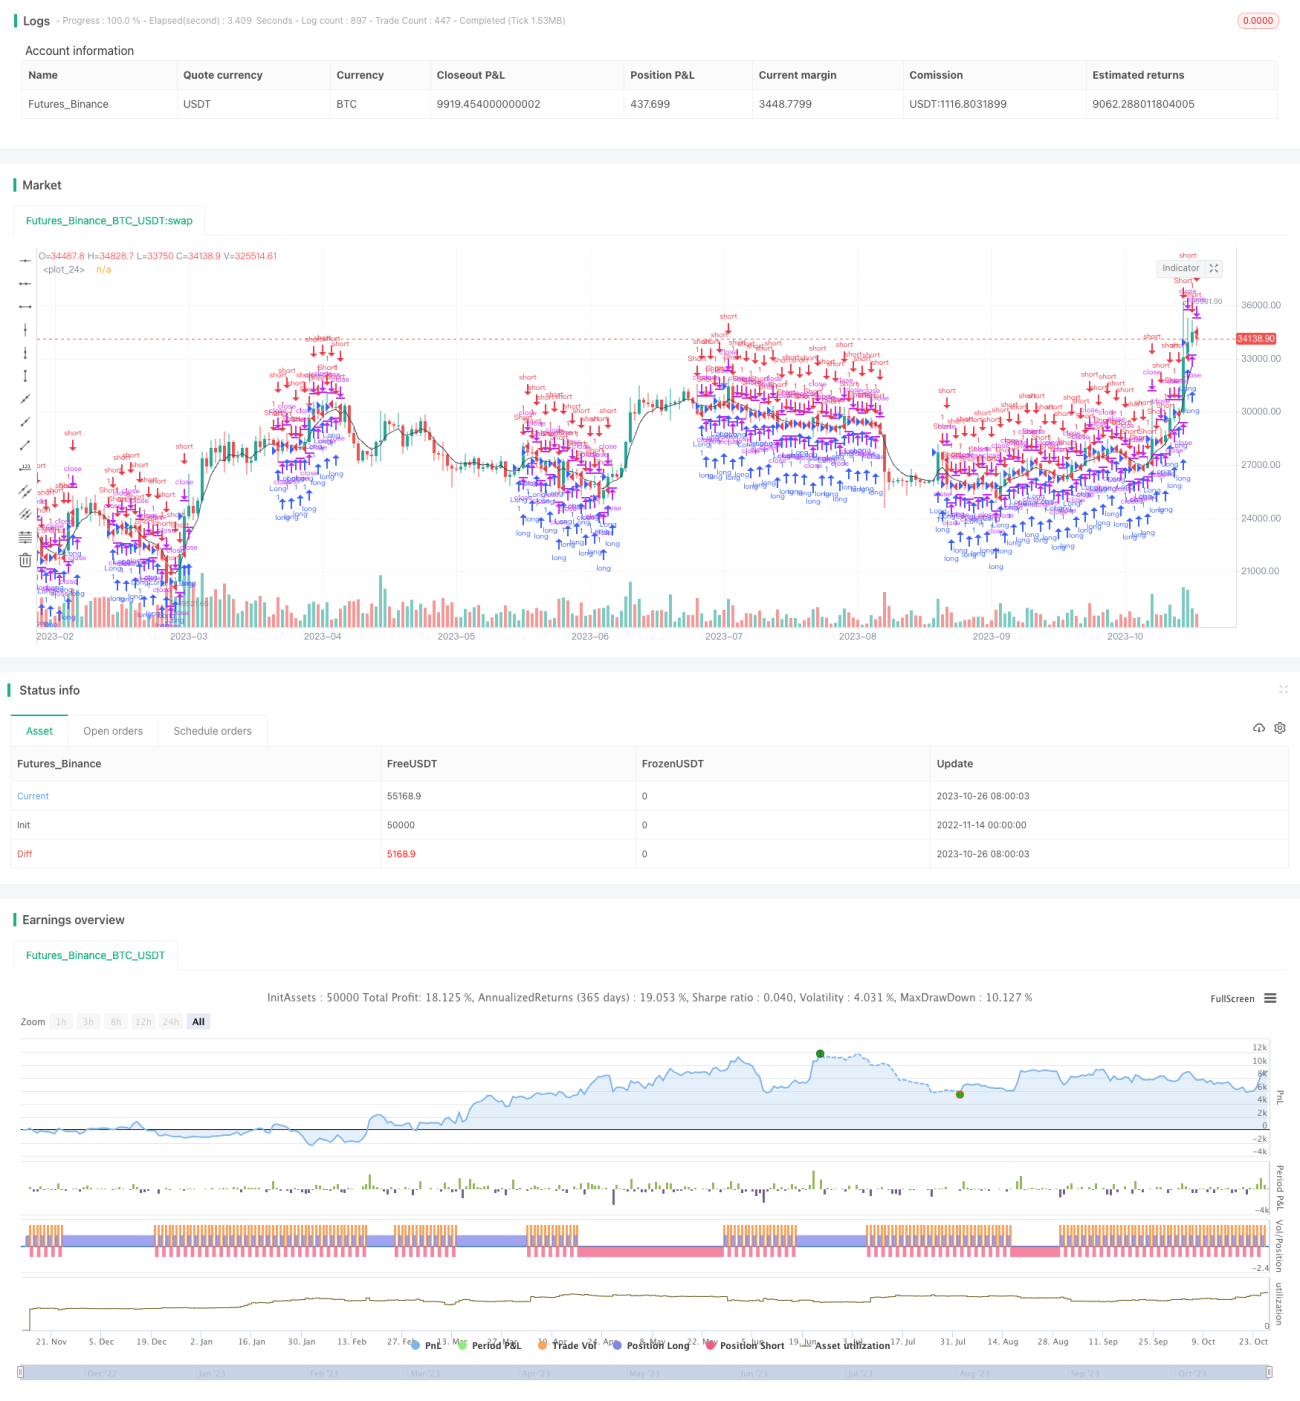
/*backtest
start: 2022-11-14 00:00:00
end: 2023-10-27 05:20:00
period: 1d
basePeriod: 1h
exchanges: [{"eid":"Futures_Binance","currency":"BTC_USDT"}]
*/

//@version=2
strategy(title = "Noro's MACD Strategy v1.0", shorttitle = "MACD str 1.0", overlay = true, default_qty_type = strategy.percent_of_equity, default_qty_value=100.0, pyramiding=0)

//Settings- 1