Cycle Reversal Trend-Following Strategy after Pullback

Overview
This strategy combines two indicators: moving average reversal and price detrend oscillator to generate trading signals and catch the rebound trend after cycle reversals.
Principles
This strategy mainly utilizes the following two technical indicators for trading signal judgment:
-
Moving Average Reversal
It calculates the price uptrend or downtrend in the past two days combined with the fast line K value to determine if a reversal signal occurs. When the price keeps rising in the past two days and the fast line K value is lower than the slow line K value, a buy signal is generated. When the price keeps falling in the past two days and the fast line K value is higher than the slow line K value, a sell signal is generated.
-
Price Detrend Oscillator
The Detrend Price Oscillator draws a horizontal moving average line and identifies price cycles based on the relationship between the price and the line. It filters out trends longer than the calculation period, thus revealing hidden short-term fluctuations. When the price is above the moving average line, it is a buy signal. When the price is below the line, it is a sell signal.
This strategy combines the signals of the two indicators. That is, when a moving average reversal signal appears and the price detrend oscillator also gives a confirming reversal signal, a trading order is generated. This can filter out some invalid reversal signals and catch the rebound trend after reversals.
Advantages
The biggest advantage of this strategy is that it makes good use of the strengths of the two indicators for complementary confirmation, which can effectively filter out invalid signals and increase signal reliability.
The moving average reversal indicator itself tends to generate false signals. Relying solely on it for judgments tends to chase tops and hit bottoms. The introduction of the price detrend oscillator for combination can avoid reversal operations in non-ideal oscillation zones.
The parameter settings of the price detrend oscillator also determine that it only identifies short-term fluctuations, which matches very well with the judgment of the moving average reversal and can identify reasonable reversal timing.
Risks
The main risks of this strategy include:
- Insufficient rebound momentum, tends to be trapped
Moving average reversals tend to occur in sideways ranges. If the rebound momentum is insufficient, it is likely to callback and touch the stop loss again, failing to profit.
- Improper parameter settings
If the parameters of the price detrend oscillator are set too large, it will identify medium- and long-term trends; if too small, it will increase misjudgment risks. Parameters need to be carefully tested for different products.
- Reversal failures due to sudden events
Major news events can disrupt existing trend judgments, resulting in failure of reversal signals. It is necessary to pay attention to fundamentals and avoid trading blindly when news events occur.
Optimization Directions
The strategy can be further optimized in the following aspects:
- Add stop loss mechanisms
Reasonably set stop loss or time stop loss to control single loss.
- Combine with volume indicators
Add volume confirmation, such as issuing signals only when breaking through the average volume, to avoid ineffective breakthroughs due to insufficient momentum.
- Dynamic parameter optimization
Dynamically optimize parameters according to market conditions, relax parameters appropriately during obvious trends, and tighten parameters during consolidations.
- Use machine learning methods for dynamic optimization
Use machine learning methods like random forest to evaluate and select parameter combinations to achieve dynamic intelligent optimization.
Summary
This strategy combines the strengths of two indicators reasonably to catch the rebound trend at reversal points. Although problems like being trapped and parameter optimization remain, the overall idea is clear and logical. It is worth further testing and optimization to achieve stable profits.
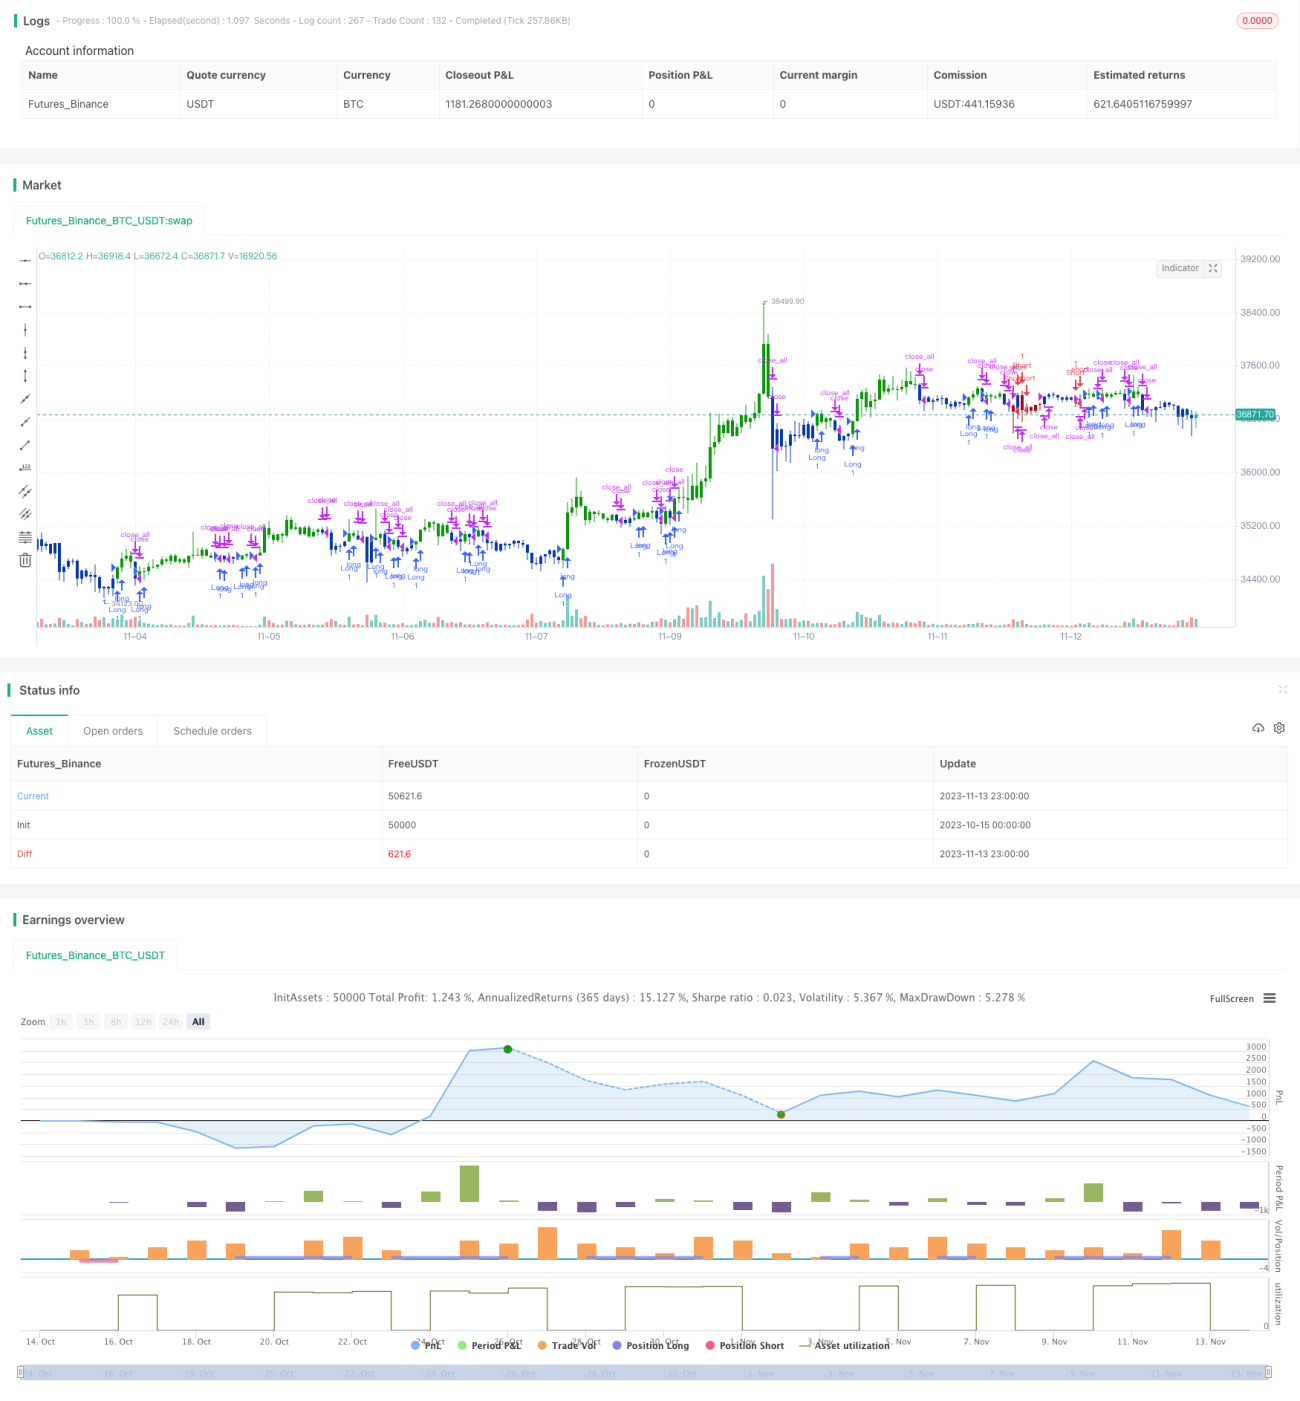
/*backtest
start: 2023-10-15 00:00:00
end: 2023-11-14 00:00:00
period: 1h
basePeriod: 15m
exchanges: [{"eid":"Futures_Binance","currency":"BTC_USDT"}]
*/

//@version=4
////////////////////////////////////////////////////////////
//  Copyright by HPotter v1.0 30/12/2019
// This is combo strategies for get a cumulative signal. - 1