Cross Timeframe Double Breakout Levels Strategy

Overview
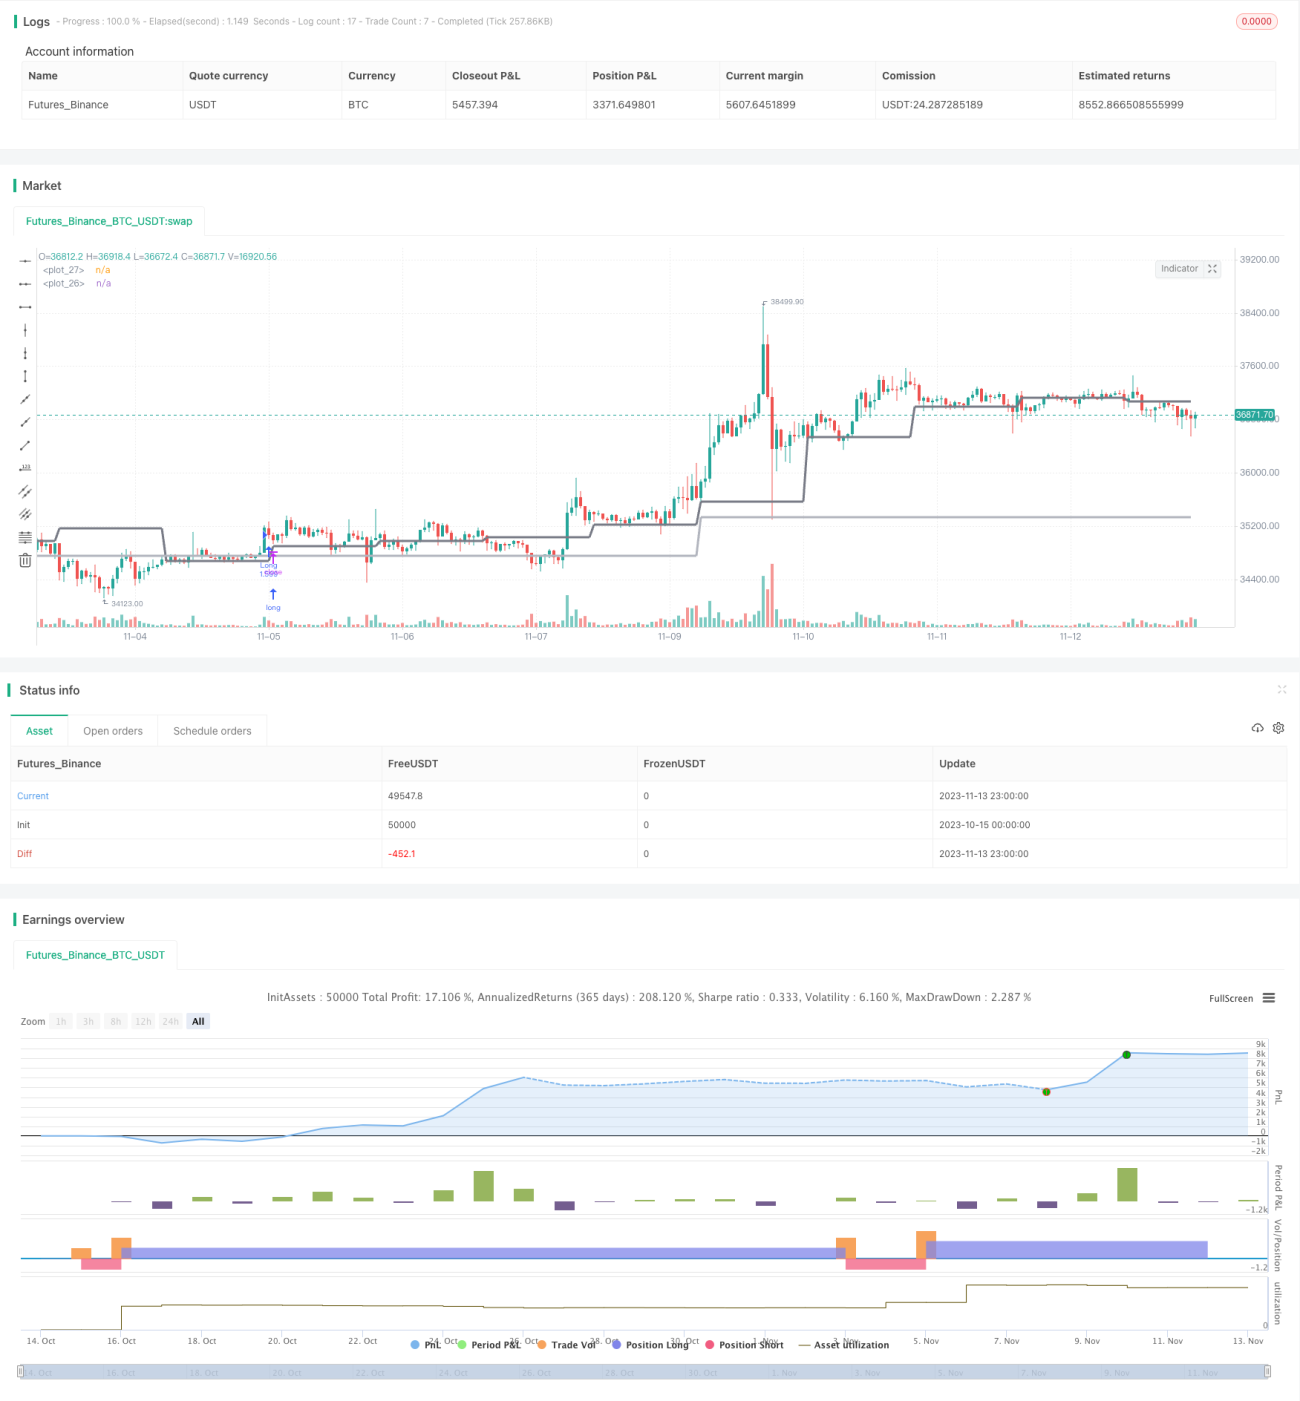
This is a strategy that utilizes key levels on different timeframes to generate double breakout trading signals. It can enter long or short positions when trend prices break through key support or resistance levels to capture mid-to-long term trends.
Strategy Logic
The strategy analyzes price action simultaneously on two different timeframes (tf and tf2), with tf being the longer timeframe reflecting the mid-to-long term trend, and tf2 being the shorter timeframe reflecting short-term moves. The strategy monitors the following trading signals:
- When price breaks above the level (level) on tf timeframe, record up1=true
- When price breaks below the level on tf timeframe, record dn1=true
- When price breaks above the level (level2) on tf2 timeframe, record up2=true
- When price breaks below the level on tf2 timeframe, record dn2=true
The trading signal is formed when up1 and up2 are true together, indicating long and short term are both bullish, go long; when dn1 and dn2 are both true, indicating long and short term both bearish, go short.
The strategy also incorporates some filters such as inverse scalping and color candlesticks to avoid wrong signals from non-trending breakouts.
Overall, the strategy takes full advantage of multi-timeframe analysis, ensuring the mid-to-long term trend meets expectations while avoiding interference from short-term market noise, generating high quality trading signals.
Advantage Analysis
-
Catch mid-to-long term trends by breaking key levels
By monitoring key level breakouts across two timeframes, it can capture clear entry signals at trend initiation stages.
-
Dual confirmation significantly reduces false signals
Requiring concurrent breakouts on two different timeframes greatly lowers false signals from random fluctuations, improving signal quality.
-
Filters such as inverse scalps and color candlesticks
Adding inverse scalping and color candle filters can remove some low quality breakout signals and prevent huge losses.
-
Simple parameter settings
The strategy only needs two timeframe parameters to function, offers flexible tuning for different products.
-
Easy to understand and optimize
The clear structure makes it easy to understand the logic, and parameters can be adjusted based on market conditions for optimization.
Risk Analysis
-
Delayed entry due to dual breakout
Compared to single breakout, dual breakout may cause some entry delay, missing early strong trend profits.
-
Key level selection
Selecting suitable key levels for different products and market cycles is very important, otherwise it may generate false signals.
-
Breakout failure
Even with dual breakout, there is still a chance of breakout failure and fast pullback, causing losses.
-
Loss from trend reversal
Late trend entries may face sudden reversal, unable to exit in time through stop loss and incur large losses.
-
Difficult parameter optimization
Although simple, finding the optimal parameter set still requires extensive testing, with high optimization difficulty.
Optimization Directions
-
Add stop loss strategies
Can set trailing stop or time stop to stop loss before loss gets too big.
-
Optimize filters
Can test different inverse scalp amplitude parameters or other filter methods.
-
Dynamic key levels
Make key levels change dynamically with market shifts rather than static levels.
-
Multi-product parameter optimization
Use machine learning to optimize best parameter sets for different products.
-
Add volume confirmation
Incorporate volume confirmation to avoid false breakout signals without volume.
Summary
Overall this is a simple and practical trend following strategy. By analyzing two timeframes it enters on mid-to-long term direction conformity to filter noise effectively. The signals are clear and easy to interpret, with intuitive parameter settings. But it also has issues like mistimed entry, difficulty selecting key levels. In summary, this strategy works better as a trend validation tool to combine with other factors, but still has much room for optimization as a standalone trading system.
- 1