Growth Producer - Dual RSI Trend Following Strategy

Author: ChaoZhang, Date: 2023-11-15 17:31:24
Tags:

img

Overview

This is a dual RSI trend following strategy that utilizes two RSI indicators for long and short trading signals, combined with a moving average system to determine trend direction. It belongs to the category of dual RSI algorithmic strategies. The strategy first uses RSI indicators to determine bullish and bearish signals, then uses moving averages to confirm the trend direction for long or short trades. It is a typical trend following strategy.

Principle Analysis

The dual RSI strategy mainly uses two RSI indicators with different timeframes for trading signals. It first sets up two RSI parameters, one longer period RSI as the main indicator, and one shorter period RSI as the auxiliary filter. When the longer period RSI breaks below the oversold line, a long signal is generated. When the shorter period RSI breaks above the overbought line, a short signal is generated. This forms the dual RSI crossover system for trading opportunities.

To filter false signals, the strategy also incorporates SMA and EMA moving averages for trend detection. Only when the short period SMA crosses above the long period EMA, the long RSI signal is considered. And only when the short SMA crosses below the long EMA, the short RSI signal is considered. This ensures RSI signals are aligned with the trend direction and avoids trading against the trend.

In addition, the strategy also sets up stop loss and take profit logic. After opening positions, two take profit orders of different sizes are placed, together with a stop loss level.

Advantage Analysis

The dual RSI algorithmic strategy has the following advantages:

  1. The dual timeframe RSI indicators can more accurately determine bullish and bearish signals. The combination of long and short period RSIs can filter some false signals and improve signal quality.

  2. The moving average system helps determine the major trend direction, avoids trading against the trend, and can filter out most noise trades, improving win rate.

  3. The flexible stop loss and take profit mechanism allows higher returns through different take profit settings, and manages risk through stop loss.

  4. The trading logic is simple and clear, easy to understand and optimize. It is suitable for algorithmic traders to learn.

Risk Analysis

Despite the advantages, the dual RSI strategy also has the following risks:

  1. RSI itself has limited effectiveness in ranging markets and trend reversals. The strategy may underperform in these market conditions.

  2. Although moving averages filter small noise, they are less effective in detecting intermediate cycle trend changes, and may miss trend turning points.

  3. Improper stop loss and take profit settings may result in stops being too wide or profits too small, deteriorating strategy performance.

  4. Large long/short positions can lead to magnified losses. Position sizing needs to be controlled.

To address these risks, parameters can be adjusted, more advanced trend and reversal indicators can be introduced, stop and profit logic optimized, and position sizing controlled to minimize risks.

Optimization Directions

The dual RSI strategy can be further optimized in the following aspects:

  1. Test different parameter combinations to find the optimal long and short RSI periods.

  2. Introduce other indicators like MACD for better trend and reversal analysis.

  3. Optimize stop loss and take profit strategies, use trailing stops or moving take profits for more flexibility.

  4. Add position sizing control module to adjust long/short positions in different trend cycle stages.

  5. Incorporate machine learning models to improve entry and exit accuracy.

  6. Backtest on different products and timeframes for optimization.

Conclusion

In summary, the dual RSI strategy is a typical trend following strategy. Its idea of combining dual RSI signals and moving average noise filtering is very classical and practical. Although there are areas for improvement, the overall logic is clear and easy to understand and optimize. This is a great strategy for algorithmic trading beginners to learn and practice. Through continuous optimization and iterations based on the “practice makes perfect” principle, stable trading results can be achieved.
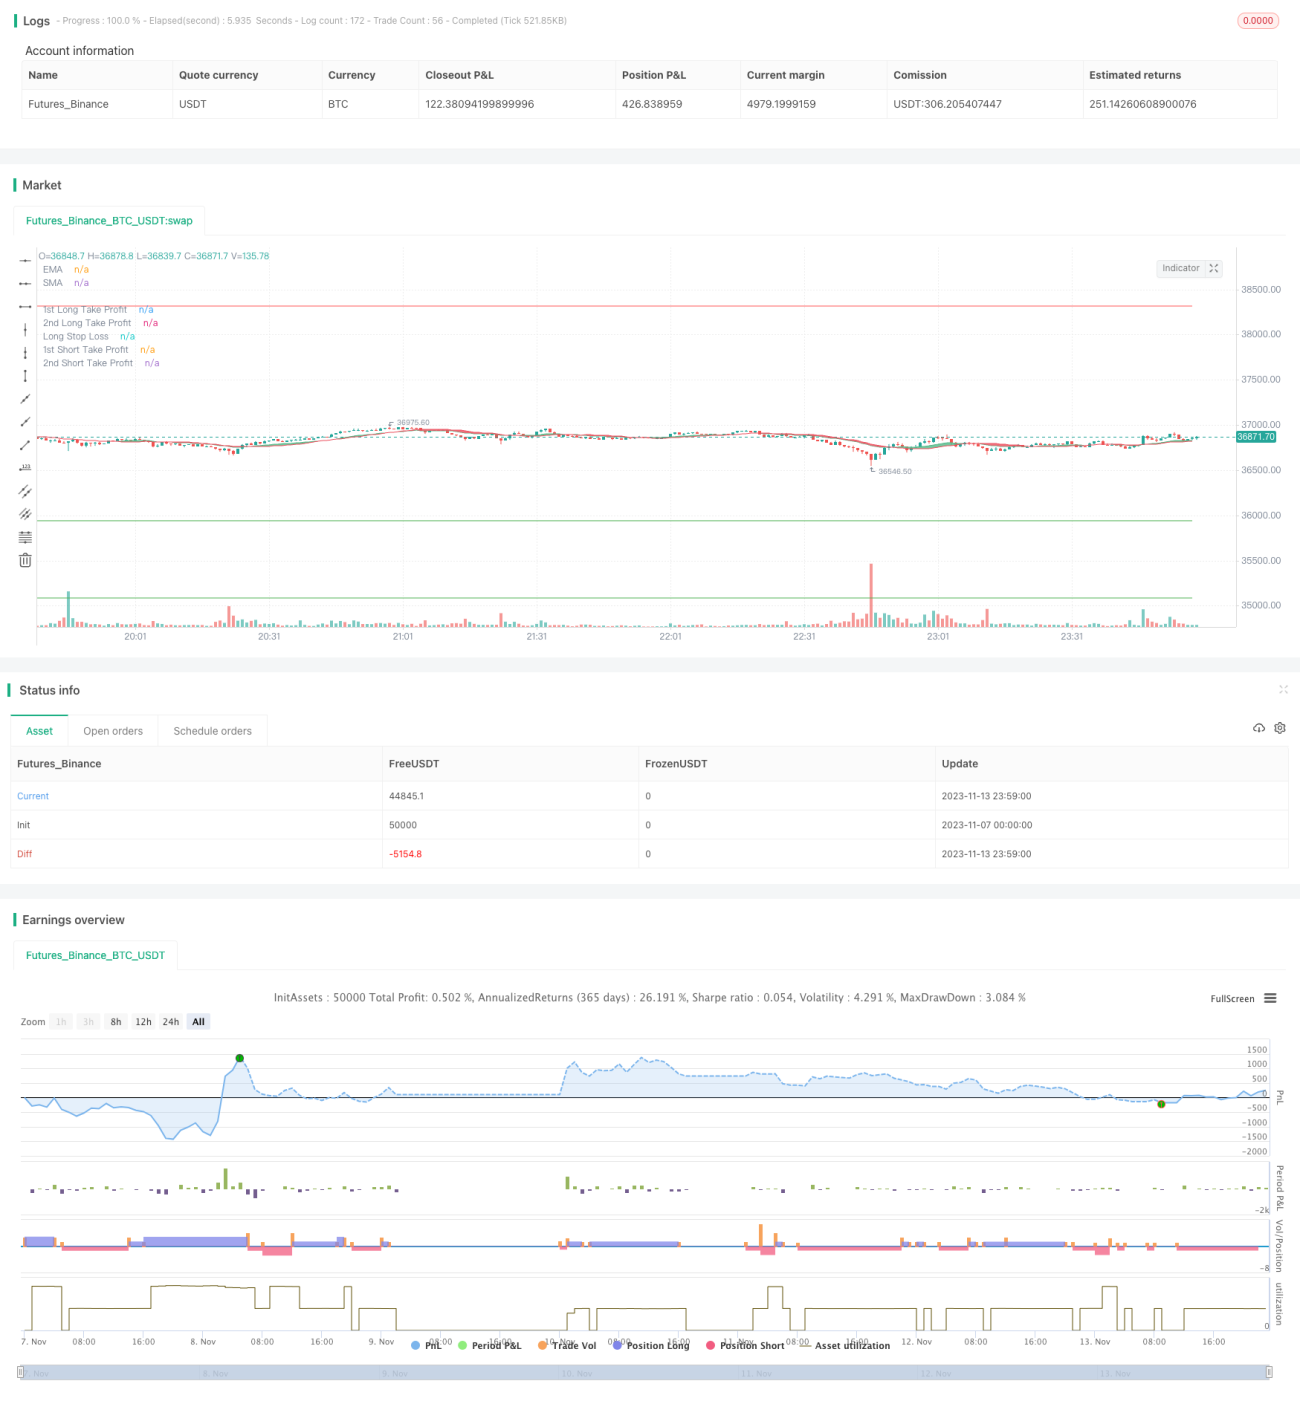

/*backtest
start: 2023-11-07 00:00:00
end: 2023-11-14 00:00:00
period: 1m
basePeriod: 1m
exchanges: [{"eid":"Futures_Binance","currency":"BTC_USDT"}]
*/

//@version=4
strategy("Growth Producer", overlay=true, initial_capital = 1000, currency = "USD", pyramiding = 2, commission_type=strategy.commission.percent, commission_value=0.07, default_qty_type = strategy.percent_of_equity, default_qty_value = 100)

//Functions
Atr(p) =>
    atr = 0.
    Tr = max(high - low, max(abs(high - close[1]), abs(low - close[1])))
    atr := nz(atr[1] + (Tr - atr[1])/p,Tr)

/// TREND
ribbon_period = input(19, "Period", step=1)

leadLine1 = ema(close, ribbon_period)
leadLine2 = sma(close, ribbon_period)

p1 = plot(leadLine1, color= #53b987, title="EMA", transp = 50, linewidth = 1)
p2 = plot(leadLine2, color= #eb4d5c, title="SMA", transp = 50, linewidth = 1)
fill(p1, p2, transp = 60, color = leadLine1 > leadLine2 ? #53b987 : #eb4d5c)

// Relative volatility index
length = input(120,"RVI period", minval=1), src = close
len = 14
stddev = stdev(src, length)
upper = ema(change(src) <= 0 ? 0 : stddev, len)
lower = ema(change(src) > 0 ? 0 : stddev, len)
rvi = upper / (upper + lower) * 100
benchmark = input(35, "RVI benchmark", minval=10, maxval=100, step=0.1)

// Plot RVI
// h0 = hline(80, "Upper Band", color=#C0C0C0)
// h1 = hline(20, "Lower Band", color=#C0C0C0)
// fill(h0, h1, color=#996A15, title="Background")
// offset = input(0, "Offset", type = input.integer, minval = -500, maxval = 500)
// plot(rvi, title="RVI", color=#008000, offset = offset)


/// MFI input
mfi_source = hlc3
mfi_length = input(19, "MFI Length", minval=1)
mfi_lower = input(15, "MFI Lower level", minval=0, maxval=50)
mfi_upper = input(90, "MFI Higher level", minval=50, maxval=100)


// MFI
upper_s = sum(volume * (change(mfi_source) <= 0 ? 0 : mfi_source), mfi_length)
lower_s = sum(volume * (change(mfi_source) >= 0 ? 0 : mfi_source), mfi_length)
mf = rsi(upper_s, lower_s)
// mfp = plot(mf, color=color.new(color.gray,0), linewidth=1)
// top = hline(mfi_upper, color=color.new(color.gray, 100), linewidth=1, editable=false)
// bottom = hline(mfi_lower, color=color.new(color.gray,100), linewidth=1, editable=false)
// hline(0, color=color.new(color.black,100), editable=false)
// hline(100, color=color.new(color.black,100), editable=false)

// Breaches
// b_color = (mf > mfi_upper) ? color.new(color.red,70) : (mf < mfi_lower) ? color.new(color.green,60) : na
// bgcolor(HighlightBreaches ? b_color : na)

// fill(top, bottom, color=color.gray, transp=75)

// Initial inputs
Act_RSI_VWAP_long = input(true, "RSI VOLUME WEIGHTED AVERAGE PRICE LONG")
RSI_VWAP_length_long = input(16, "RSI-VWAP LENGTH LONG")
RSI_VWAP_overSold_long = input(13, "RSI-VWAP OVERSOLD LONG", type=input.float)
RSI_VWAP_overBought_long = input(68, "RSI-VWAP OVERBOUGHT LONG", type=input.float)

Act_RSI_VWAP_short = input(true, "RSI VOLUME WEIGHTED AVERAGE PRICE SHORT")
RSI_VWAP_length_short = input(14, "RSI-VWAP LENGTH SHORT")
RSI_VWAP_overSold_short = input(7, "RSI-VWAP OVERSOLD SHORT", type=input.float)
RSI_VWAP_overBought_short = input(68, "RSI-VWAP OVERBOUGHT SHORT", type=input.float)

// RSI with VWAP as source
RSI_VWAP_long = rsi(vwap(close), RSI_VWAP_length_long)
RSI_VWAP_short = rsi(vwap(close), RSI_VWAP_length_short)

// Plot Them Separately.
// Plotting LONG, Put overlay=false
// r=plot(RSI_VWAP_long, color = RSI_VWAP_long > RSI_VWAP_overBought_long ? color.red : RSI_VWAP_lnog < RSI_VWAP_overSold_long ? color.lime : color.blue, title="rsi", linewidth=2, style=plot.style_line)
// h1=plot(RSI_VWAP_overBought_long, color = color.gray, style=plot.style_stepline)
// h2=plot(RSI_VWAP_overSold_long, color = color.gray, style=plot.style_stepline)
// fill(r,h1, color = RSI_VWAP_long > RSI_VWAP_overBought_long ? color.red : na, transp = 60)
// fill(r,h2, color = RSI_VWAP_long < RSI_VWAP_overSold_long ? color.lime : na, transp = 60)

// Plotting SHORT, Put overlay=false
// r=plot(RSI_VWAP_short, color = RSI_VWAP_short > RSI_VWAP_overBought_short ? color.red : RSI_VWAP_short < RSI_VWAP_overSold_short ? color.lime : color.blue, title="rsi", linewidth=2, style=plot.style_line)
// h1=plot(RSI_VWAP_overBought_short, color = color.gray, style=plot.style_stepline)
// h2=plot(RSI_VWAP_overSold_short, color = color.gray, style=plot.style_stepline)
// fill(r,h1, color = RSI_VWAP_short > RSI_VWAP_overBought_short ? color.red : na, transp = 60)
// fill(r,h2, color = RSI_VWAP_short < RSI_VWAP_overSold_short ? color.lime : na, transp = 60)


///////  STRATEGY Take Profit / Stop Loss ////////
////// LONG //////

long_tp1_inp = input(3.3, title='Long Take Profit 1 %', step=0.1)/100
long_tp1_qty = input(15, title="Long Take Profit 1 Qty", step=1)

long_tp2_inp = input(12, title='Long Take Profit 2%', step=0.1)/100
long_tp2_qty = input(100, title="Long Take Profit 2 Qty", step=1)

long_sl_inp = input(3.3, title='Long Stop Loss %', step=0.1)/100

long_take_level_1 = strategy.position_avg_price * (1 + long_tp1_inp)
long_take_level_2 = strategy.position_avg_price * (1 + long_tp2_inp)
long_stop_level = strategy.position_avg_price * (1 - long_sl_inp)

////// SHORT //////
short_tp1_inp = input(3.2, title='Short Take Profit 1 %', step=0.1)/100
short_tp1_qty = input(20, title="Short Take Profit 1 Qty", step=1)

short_tp2_inp = input(5.5, title='Short Take Profit 2%', step=0.1)/100
short_tp2_qty = input(100, title="Short Take Profit 2 Qty", step=1)

short_sl_inp = input(3.2, title='Short Stop Loss %', step=0.1)/100

short_take_level_1 = strategy.position_avg_price * (1 - short_tp1_inp)
short_take_level_2 = strategy.position_avg_price * (1 - short_tp2_inp)
short_stop_level = strategy.position_avg_price * (1 + short_sl_inp)


///Strategy_Conditions
/// LONG ///
entry_long =(crossover(RSI_VWAP_long, RSI_VWAP_overSold_long) and leadLine2<leadLine1) or (crossunder(mf,mfi_lower) and leadLine2<leadLine1)
entry_price_long=valuewhen(entry_long,close,0)
exit_long =crossunder(RSI_VWAP_long, RSI_VWAP_overBought_long)

/// SHORT ///

entry_short =crossunder(RSI_VWAP_short, RSI_VWAP_overBought_short) and leadLine2>leadLine1 or (crossover(mf,mfi_upper) and leadLine2>leadLine1)
entry_price_short=valuewhen(entry_short,close,0)
exit_short =crossover(RSI_VWAP_short, RSI_VWAP_overSold_short)

////// BACKTEST PERIOD ///////
testStartYear = input(2019, "Backtest Start Year")
testStartMonth = input(1, "Backtest Start Month")
testStartDay = input(1, "Backtest Start Day")
testPeriodStart = timestamp(testStartYear,testStartMonth,testStartDay,0,0)

testStopYear = input(2020, "Backtest Stop Year")
testStopMonth = input(12, "Backtest Stop Month")
testStopDay = input(31, "Backtest Stop Day")
testPeriodStop = timestamp(testStopYear,testStopMonth,testStopDay,0,0)

testPeriod() => true

if testPeriod()

    if strategy.position_size == 0 or strategy.position_size > 0 and rvi>benchmark
        strategy.entry("long", true, when = entry_long, comment="Insert Enter Long Comment")
    strategy.exit("TP1","long", qty_percent=long_tp1_qty, limit=long_take_level_1, stop=long_stop_level)
    strategy.exit("TP2","long", qty_percent=long_tp2_qty, limit=long_take_level_2, stop=long_stop_level)
    strategy.close("long", when=exit_long, comment = "Insert Exit Long Comment")

    if strategy.position_size == 0 or strategy.position_size < 0 and rvi>benchmark
        strategy.entry("short", false, when = entry_short, comment="Insert Enter Short Comment")
    strategy.exit("TP1","short", qty_percent=short_tp1_qty, limit=short_take_level_1, stop=short_stop_level)
    strategy.exit("TP2","short", qty_percent=short_tp2_qty, limit=short_take_level_2, stop=short_stop_level)
    strategy.close("short", when=exit_short, comment = "Insert Exit Short Comment")


// LONG POSITION
plot(strategy.position_size > 0 ? long_take_level_1 : na, style=plot.style_linebr, color=color.green, linewidth=1, title="1st Long Take Profit")
plot(strategy.position_size > 0 ? long_take_level_2 : na, style=plot.style_linebr, color=color.green, linewidth=1, title="2nd Long Take Profit")
plot(strategy.position_size > 0 ? long_stop_level : na, style=plot.style_linebr, color=color.red, linewidth=1, title="Long Stop Loss")


// SHORT POSITION
plot(strategy.position_size < 0 ? short_take_level_1 : na, style=plot.style_linebr, color=color.green, linewidth=1, title="1st Short Take Profit")
plot(strategy.position_size < 0 ? short_take_level_2 : na, style=plot.style_linebr, color=color.green, linewidth=1, title="2nd Short Take Profit")
plot(strategy.position_size < 0 ? short_stop_level : na, style=plot.style_linebr, color=color.red, linewidth=1, title="Long Stop Loss")

More