Volume Flow Indicator Based Trend Following Strategy

Overview
This strategy judges market trend direction by calculating changes in trading volume, and adopts a trend following approach by establishing positions at the beginning of trends and closing positions when trends end.
Strategy Logic
- Calculate typical price typical, logarithmic return inter, and return variance vinter
- Calculate average trading volume vave, maximum trading volume threshold vmax
- Calculate price change mf, compare with variance threshold cutoff to get price driven momentum vcp
- Sum vcp to get volume price indicator vfi, calculate vfi and its moving average vfima
- Compare vfi with vfima to get the difference dVFI and determine trend direction
- When dVFI crosses above 0, it is a bullish signal, and when crossing below 0, it is a bearish signal
- Establish long and short strategies based on dVFI patterns
Advantage Analysis
-
The strategy fully considers the impact of trading volume changes on trend judgment, using momentum indicators to measure trend strength and more accurately capture trend turning points.
-
The strategy incorporates trading volume threshold calculation to filter normal fluctuations and only capture collective behavior of large funds, avoiding being misled by market noise.
-
The combined consideration of price and volume can effectively avoid false breakouts.
-
The use of moving averages and logical criteria filters out most false signals.
-
Following trends rather than predicting reversals is well suited for medium-to-long term trend trading and capturing the market's main direction.
Risk Analysis
-
The strategy relies mainly on trading volume changes to determine trends, and its effectiveness may be compromised in products with inactive trading volume.
-
Trading volume data can be manipulated, potentially generating misleading signals, so price-volume divergences need to be watched out for.
-
Price-volume relationships are often lagging, potentially missing the optimal entry timing at the beginning of trends.
-
Crude stop loss methods may prematurely exit trades, unable to persistently capture trends.
-
Unable to respond effectively to short-term corrections, and may be insensitive to sudden events.
Consider incorporating moving averages, volatility indicators to optimize entries and stops; analyzing price-volume with more data sources to avoid misleading signals; incorporating appropriate technical indicators to improve responsiveness to short-term corrections.
Optimization Directions
-
Optimize entry conditions by incorporating moving averages, ichimoku kinko hyo etc to confirm entries after trend starts.
-
Optimize stops with trailing stops, staged stops etc to make stops adhere closely to price and track trend stops.
-
Add trend metrics like ADX to avoid incorrect trades in range-bound and choppy markets.
-
Optimize parameters through longer backtests to find optimal parameter combinations.
-
Expand strategy to more products, searching for higher quality instruments with active volume.
-
Consider adding machine learning models to leverage more data for price-volume analysis and improve signal quality.
Conclusion
The overall strategy logic is clear, with intuitive core indicators reliably identifying trend direction. The advantage lies in emphasizing trading volume changes, suitable for tracking medium-to-long term trends, but misleading signals need to be watched out for. Further improvements in parameters, stop losses, indicator combinations can enhance live performance.
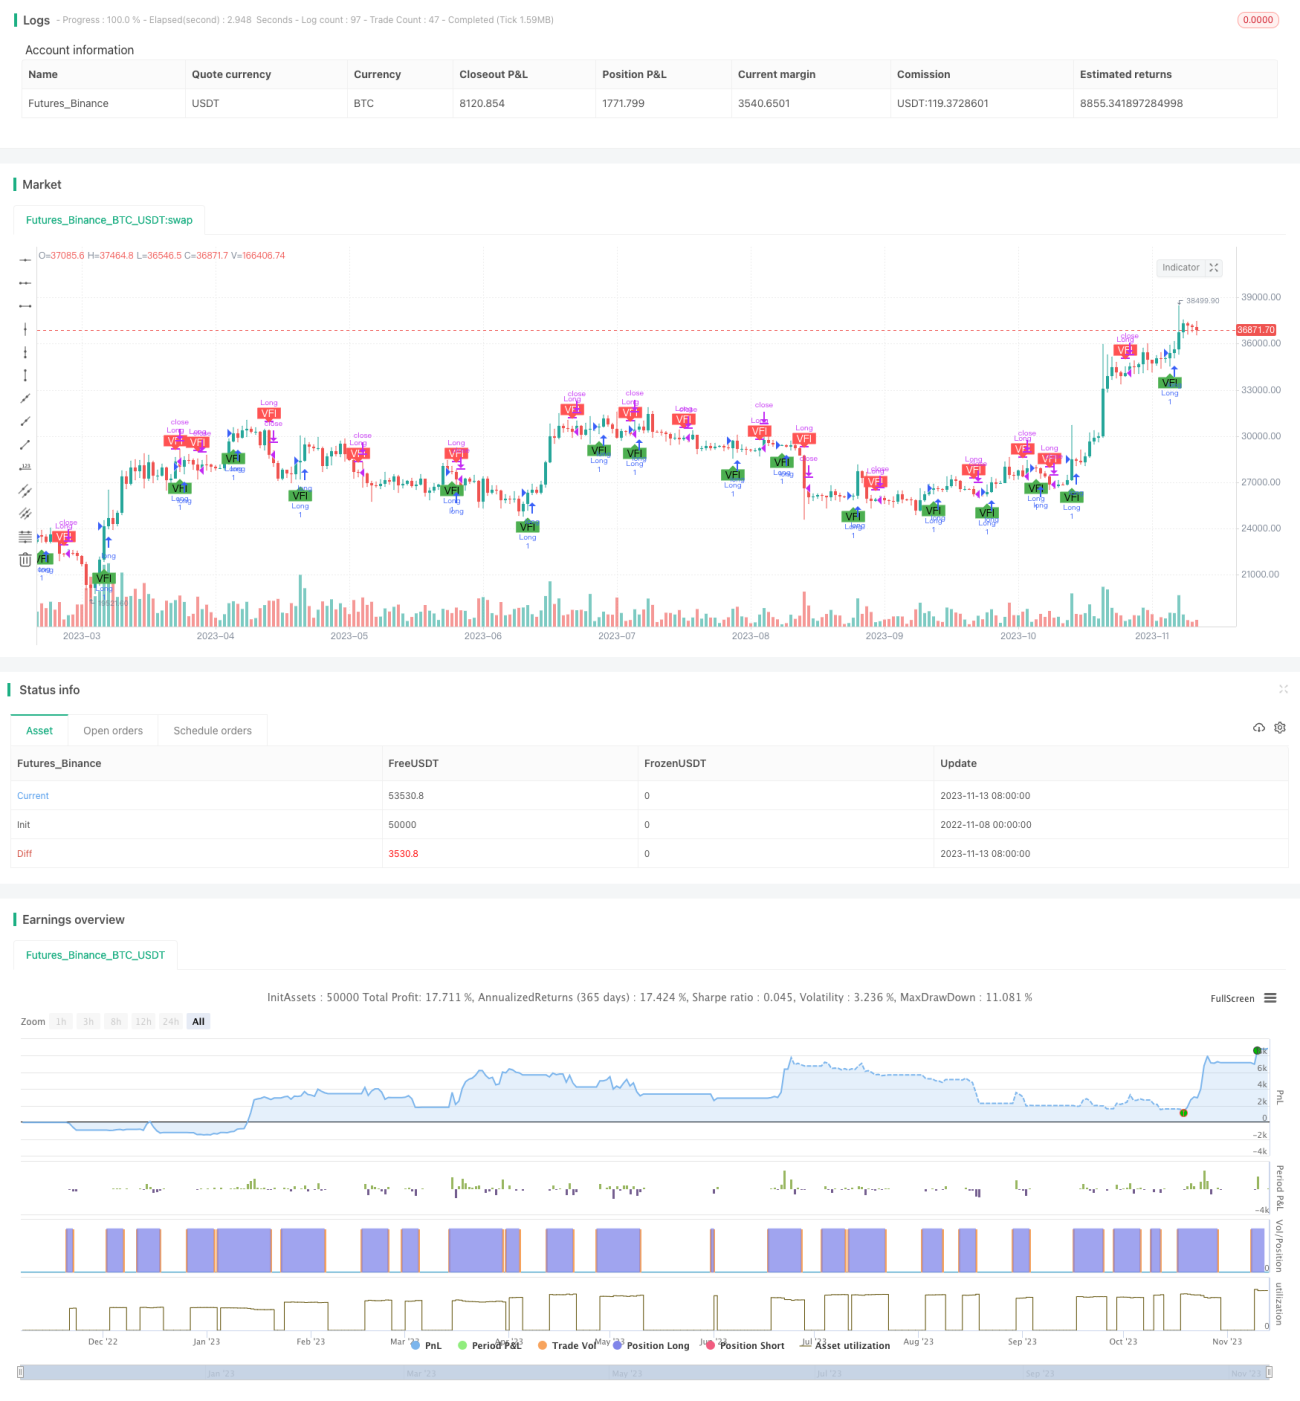
/*backtest
start: 2022-11-08 00:00:00
end: 2023-11-14 00:00:00
period: 1d
basePeriod: 1h
exchanges: [{"eid":"Futures_Binance","currency":"BTC_USDT"}]
*/

//@version=4
strategy("Strategy for Volume Flow Indicator with alerts and markers on the chart", overlay=true)
// This indicator has been copied form Lazy Bear's code
lengthVFI = 130 - 1