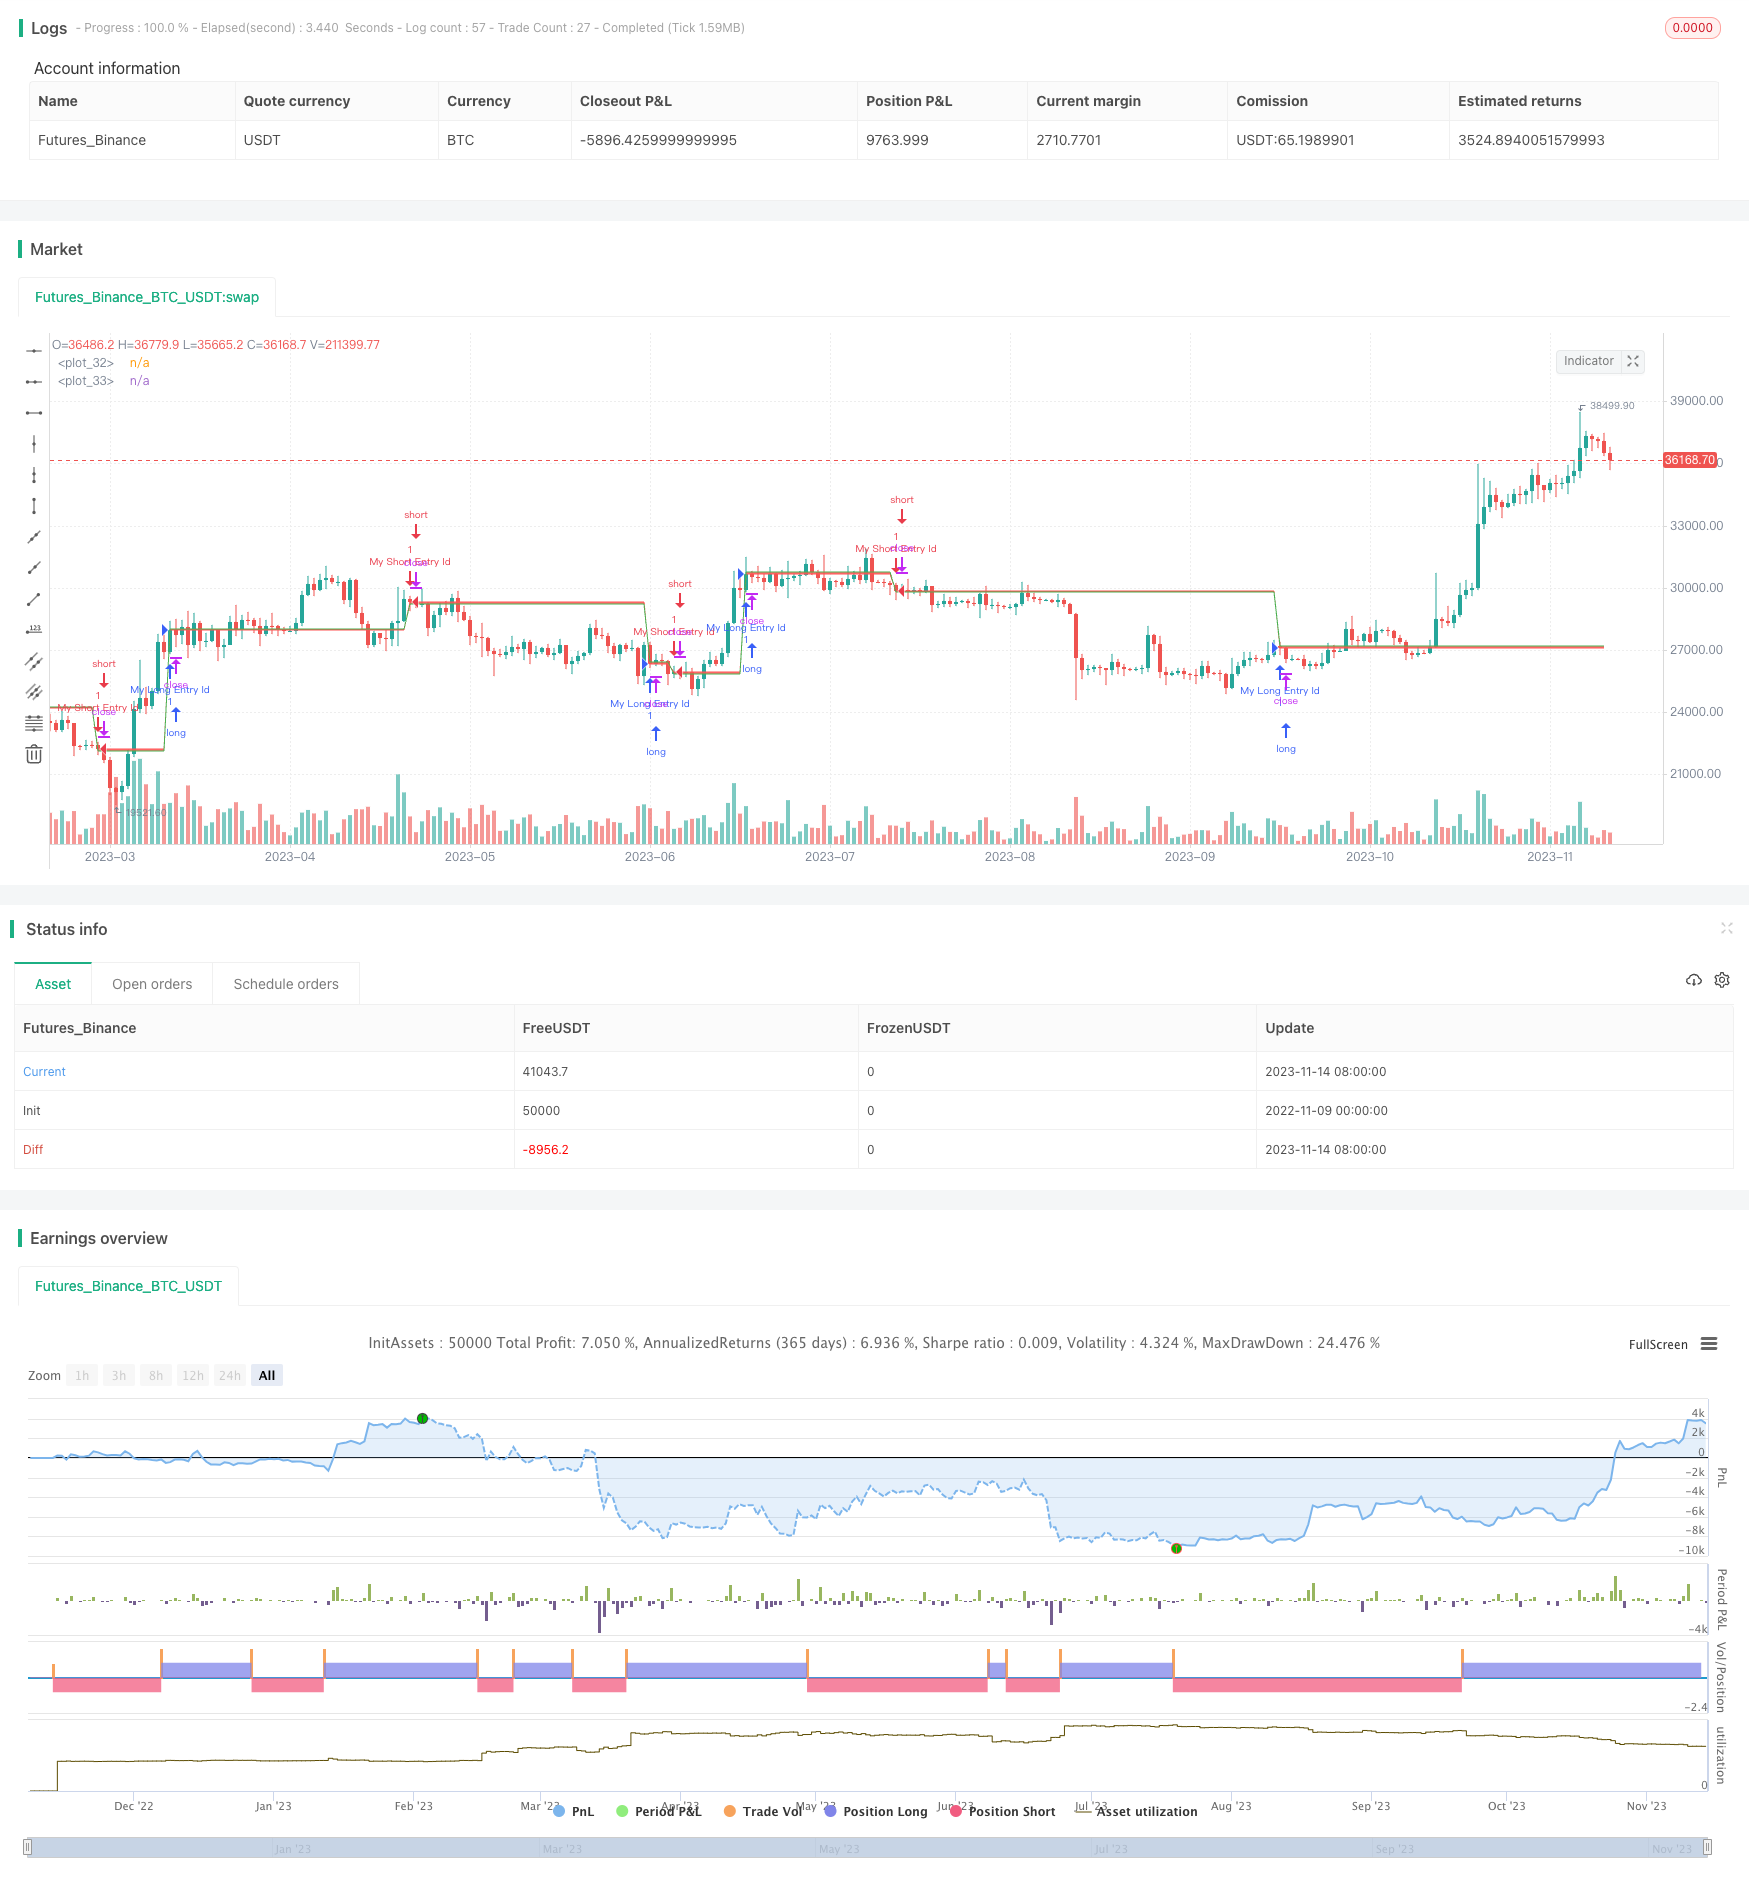
Break-even Price Strategy

Author: ChaoZhang, Date: 2023-11-16 11:16:25
Tags:

img

Overview

The main idea of this strategy is to plot the entry price and breakeven price after opening a position, to visually display the price level where a breakout above the entry price would result in profit. This can help traders better manage positions and realize profits.

Strategy Logic

The code enters long when SMA crossover happens and enters short on SMA crossunder. It then calculates the entry price and breakeven price after fees. The breakeven price is calculated as: for long, breakeven price = entry price * (1 + fees); for short, breakeven price = entry price * (1 - fees). Finally, it plots the entry price line and breakeven price line, filling the area between them.

This way, once the price breaks through the entry price line, it means the trade is now profitable. Traders can use the breakeven line to set take profit or stop loss levels to lock in profits.

The key components of the code are:

  1. Entry condition checks
  2. Calculation of entry and breakeven prices
  3. Plotting the entry and breakeven price lines
  4. Filling color between the two lines

With simple condition checks for entry, breakeven price calculation, and plotting of auxiliary lines, the break-even price strategy is implemented.

Advantage Analysis

The advantages of this strategy include:

  1. Intuitive display of profit/loss, can quickly judge if price has reached profit target.

  2. Can use breakeven line to set take profit/stop loss levels to avoid increasing losses.

  3. Simple and easy to understand code, easy to implement and adjust.

  4. Can be incorporated into own trading strategies, using breakeven line to manage positions.

  5. Easy to modify fee parameters for different exchanges and products.

  6. Can optimize entry by adjusting SMA periods.

Risk Analysis

The risks of this strategy include:

  1. SMA has lagging nature, may miss price changes.

  2. Breakeven line cannot completely avoid losses.

  3. No exit mechanism, traders need to monitor P/L themselves.

  4. Incorrect fee settings may cause wrong breakeven calculation.

  5. Slippage is not considered.

  6. No stop loss, may lead to large losses.

The solutions are:

  1. Consider more sensitive indicators like MACD.

  2. Add trend indicator to avoid counter trend trades.

  3. Add take profit and stop loss logic for automatic exits.

  4. Set accurate fees based on actual exchange.

  5. Add fixed slippage for optimal entries and exits.

  6. Add trailing stop loss to limit max loss.

Improvement Areas

Some ways to optimize the strategy:

  1. Replace SMA with more advanced indicators like MACD or KDJ.

  2. Add trend filter to avoid counter trend trades.

  3. Optimize SMA periods for better entry precision.

  4. Add take profit and stop loss logic for automatic exits.

  5. Set slippage for backtest and live trading.

  6. Optimize fee settings to match reality.

  7. Add trailing stop loss to limit max loss.

  8. Run strategy on multiple timeframes for diversification.

  9. Incorporate volume changes to improve entry.

  10. Use machine learning to optimize parameters.

Conclusion

This strategy intuitively displays the breakeven price level where a breakout can result in profits. It is a simple and practical auxiliary strategy with advantages like simple code and easy implementation. But risks need to be addressed too. We can optimize it from many aspects to make it more robust and profitable. Overall it provides a great reference example worth studying and applying.


/*backtest
start: 2022-11-15 00:00:00
end: 2023-11-15 00:00:00
period: 1d
basePeriod: 1h
exchanges: [{"eid":"Futures_Binance","currency":"BTC_USDT"}]
*/

// © NikitaDoronin
//@version=4

strategy("Plot Break-even Price", overlay=true)

/// Break-even calculation
ep = 0.0
ep := na(ep[1]) ? na : ep[1]

p = 0.0
p := na(p[1]) ? na : p[1]

/// Fees Input
fee_inp = input(0.25, title='Price Change in %', step=0.1)/100

/// Your Strategy calculation
longCondition = crossover(sma(close, 14), sma(close, 28))
shortCondition = crossunder(sma(close, 14), sma(close, 28))

/// Stategy Entry
if (longCondition)
    ep := close
    p := close * (1 + fee_inp)
    strategy.entry("My Long Entry Id", strategy.long)

if (shortCondition)
    ep := close
    p := close * (1 - fee_inp)
    strategy.entry("My Short Entry Id", strategy.short)

/// Plot Break-even Price 
p1 = plot(ep, color = color.red, transp = 85)
p2 = plot(p, color = color.green)
fill(p1, p2, color = color.red, transp = 85)

More