RSI Divergence Strategy

Overview
This strategy determines long and short positions by calculating RSI indicator and crossovers between RSI EMA lines, combined with divergences between RSI and price to find potential trading signals. It belongs to trend following strategies.
Strategy Logic
-
Calculate 14-period RSI indicator, RSI crossing above 50 is buy signal and crossing below 50 is sell signal.
-
Calculate 20-period EMA and 14-period EMA of RSI, fast EMA crossing above slow EMA is buy signal and crossing below is sell signal.
-
Detect divergences between RSI and price:
-
Regular bullish divergence: price makes new low but RSI does not, buy signal
-
Hidden bullish divergence: price makes new high but RSI does not, buy signal
-
Regular bearish divergence: price makes new high but RSI does not, sell signal
-
Hidden bearish divergence: price makes new low but RSI does not, sell signal
- Stop loss strategies can be enabled, including percentage-based and ATR-based.
Advantage Analysis
-
RSI indicator is good at detecting overbought and oversold situations. EMAs can smooth out noise in data.
-
Divergences between RSI and price can provide early reversal signals.
-
Combining signals from two indicators can validate each other and improve strategy stability.
-
Stop loss mechanisms control single trade loss.
Risk Analysis
-
As a momentum indicator, RSI may underperform when price fluctuates violently.
-
EMAs have time lag and cannot precisely locate turning points.
-
Divergence signals may produce false signals when trend continues.
-
Improper stop loss setting may cause unnecessary loss.
-
Drawdown can be large, sufficient capital is needed.
Optimization Directions
-
Test different parameters for RSI and EMA calculation to find optimal combinations.
-
Consider replacing EMA with other indicators like MACD for ensemble optimization.
-
Add confirmation mechanisms to avoid false divergences, e.g. requiring consecutive signals.
-
Add profit taking strategies to lock in gains.
-
Incorporate short-term signals like candlestick patterns for entry, combined with trend judgment of this strategy.
Summary
This strategy integrates overbought/oversold detection of RSI, trend following with EMA, and reversal prediction of divergences into a systematic trend tracking system. With parameter tuning and ensemble optimization, good results can be achieved. But risks like trend shocks and false signals should be guarded against. With proper money management, this strategy can produce steady excess returns in medium-to-long term.
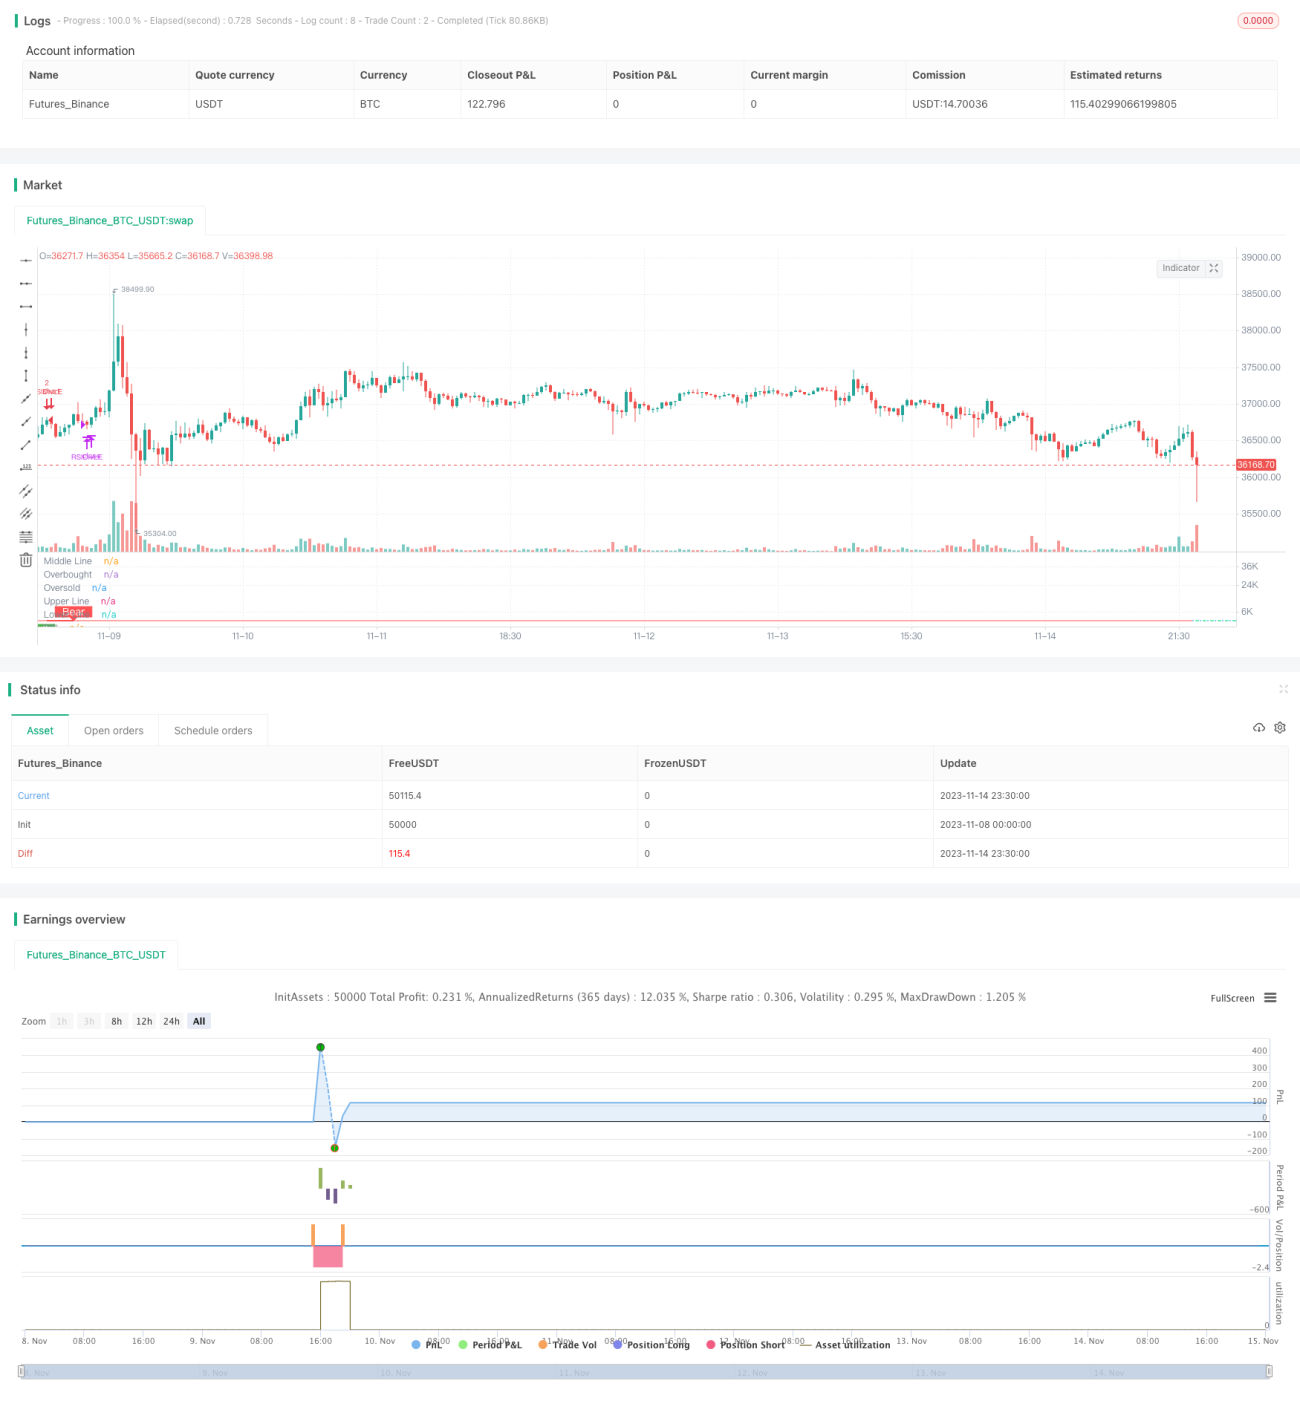
/*backtest
start: 2023-11-08 00:00:00
end: 2023-11-15 00:00:00
period: 30m
basePeriod: 15m
exchanges: [{"eid":"Futures_Binance","currency":"BTC_USDT"}]
*/

//@version=4
strategy(title="RSI Divergence Indicator", overlay=false,pyramiding=2, default_qty_value=2,   default_qty_type=strategy.fixed, initial_capital=10000, currency=currency.USD)

len = input(title="RSI Period", minval=1, defval=14)- 1