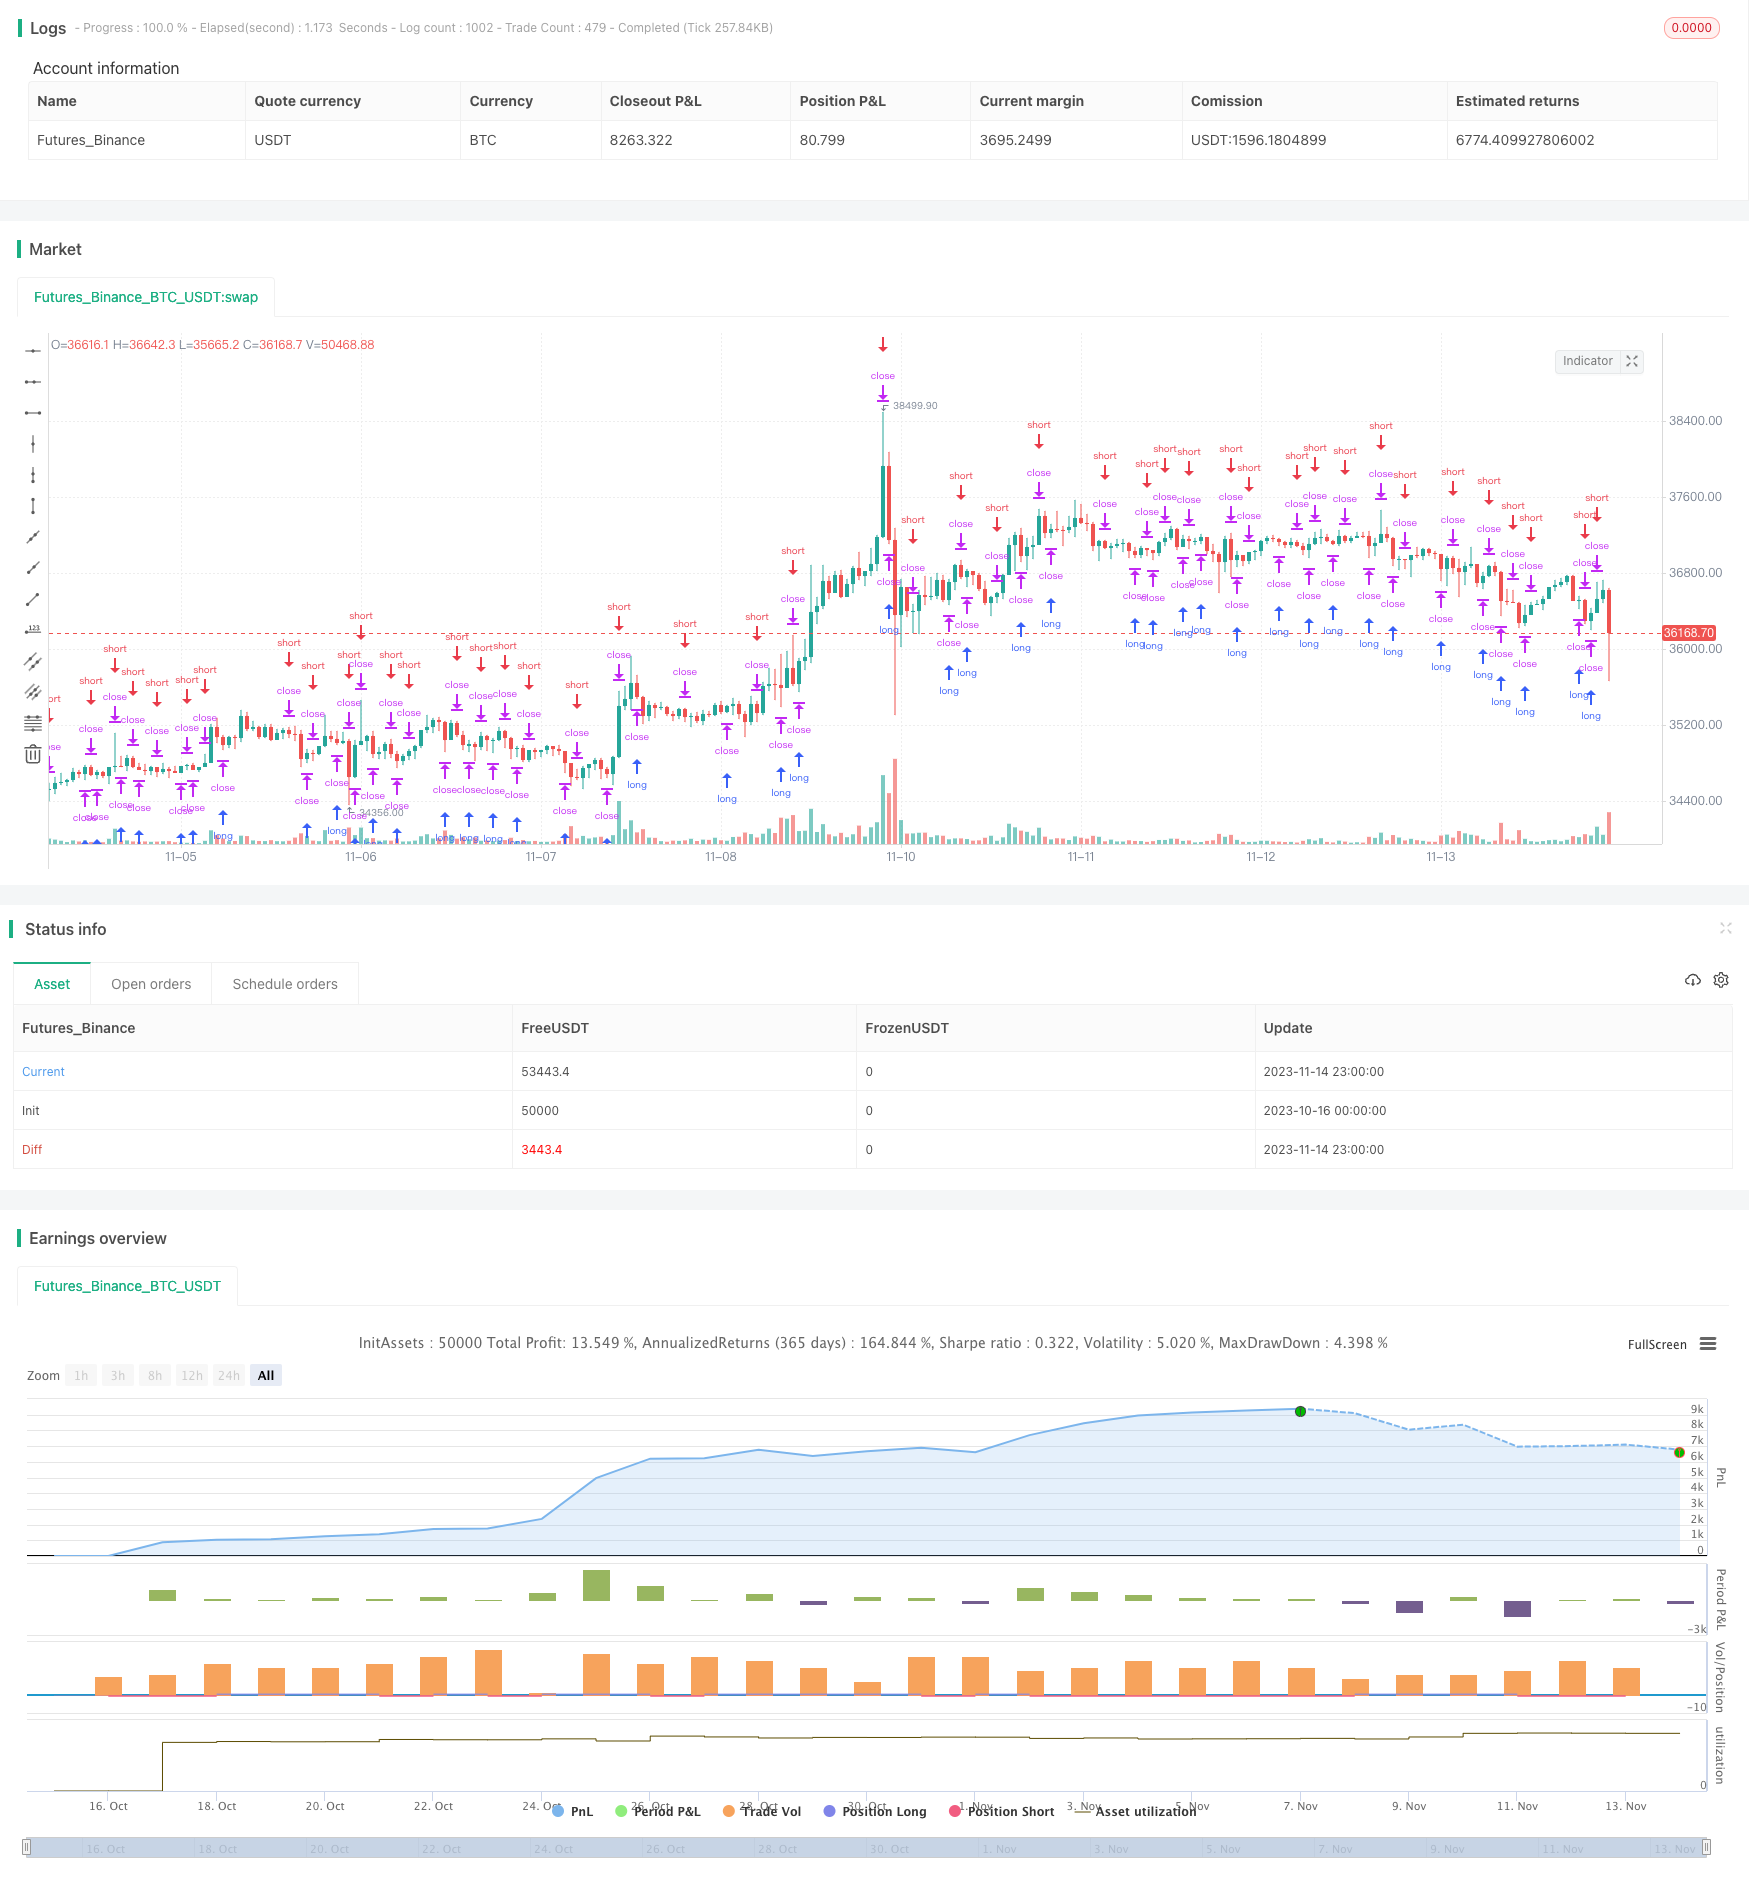
概述
该策略通过比较数字货币的RSI指标与加密市场指数的RSI指标,判断数字货币相对于加密市场的价值,产生交易信号。
策略原理
该策略首先允许选择一个加密市场指数,如总市值、总市值除比特币、其他币种总市值等。同时选择一个更高时间周期的加密市场指数,默认是日线。然后计算选定数字货币的RSI指标和该加密市场指数的RSI指标,通过比值得到一个相对强弱指数。当该相对强弱指数上穿指定参数时,产生买入信号;当下穿时,产生卖出信号。
该策略的核心逻辑是,当数字货币的RSI强于加密市场指数时,说明该币种相对市场价值被低估,具有被高估价值的可能,所以可以买入;当数字货币RSI弱于市场指数时,说明该币种相对市场已被高估,具有被低估的可能,所以可以卖出。通过相对强弱指数,可以更准确地判断价值。
优势分析
该策略最大的优势在于利用了相对强弱指数指标,可以更准确判断数字货币的价值,而不是仅仅根据单一币种本身的技术指标来决策,避免了只看一隅的困局。
相对强弱指数充分考虑了市场整体环境对单一币种的影响,能够把握市场轮动的节奏,以及不同板块的流动,挖掘市场中的价值币种。
另外,该策略提供了多种指数选择,可以根据不同市场环境,选择最适合的指数进行交易,这为策略的效果提供了保障。
风险分析
该策略主要风险在于,相对强弱指数仅是一个价值判断工具,不能完全避免单一币种自身的技术形态产生的交易风险。
例如,如果该币进入了明显的头肩顶背驰形态,市场结构发生转变,仅凭相对强弱指数买入信号,可能会产生损失。
因此,该策略还需要结合数字货币本身的技术形态,避免在关键技术点产生不理想的交易。
另一个风险在于,如果选择的指数不当,与数字货币不具有高相关性,则相对强弱指数的指示作用将会大打折扣。这需要根据不同币种与市场指数的相关性优化选择。
优化方向
该策略可以从以下几个方面进行优化:
增加止损策略,在币种价格反转时及时止损。
优化指数的选择,不同币种可以匹配不同的指数,提高相关性。
增加多个时间周期进行组合,例如日线指标与4小时线指标进行确认,可以提高信号的可靠性。
增加机器学习算法,通过自适应方式确定相对强弱指数的阈值,而不是使用固定参数。
结合情感分析、基本面分析等其它指标,形成更全面的价值判断体系。
总结
该相对强弱指数策略通过比较数字货币与市场指数的强弱关系,判断出币种的相对价值高低,形成交易信号。策略优势在于增加了市场分析的维度,可以把握市场的节奏。但也存在一定的风险,需要进行优化,增加止损、时间周期组合、自适应阈值等手段来提升效果。如果应用得当,该策略可以在数字货币量化交易中发挥重要作用。
/*backtest
start: 2023-10-16 00:00:00
end: 2023-11-15 00:00:00
period: 1h
basePeriod: 15m
exchanges: [{"eid":"Futures_Binance","currency":"BTC_USDT"}]
*/

//@version=5
strategy('RSI correlation with cryptoindices [strategy version]', overlay=false)

// Testing Start dates
testStartYear = input(2016, 'Backtest Start Year')
testStartMonth = input(1, 'Backtest Start Month')
testStartDay = input(1, 'Backtest Start Day')
testPeriodStart = timestamp(testStartYear, testStartMonth, testStartDay, 0, 0)
//Stop date if you want to use a specific range of dates
testStopYear = input(2030, 'Backtest Stop Year')
testStopMonth = input(12, 'Backtest Stop Month')
testStopDay = input(30, 'Backtest Stop Day')
testPeriodStop = timestamp(testStopYear, testStopMonth, testStopDay, 0, 0)
testPeriod() =>
    time >= testPeriodStart and time <= testPeriodStop ? true : false

len = input(4, title='length of rsi comparison')
correlationcrossover = input(1, title='correlation crossover')
IndexSwitch = input.string('CRYPTOCAP:TOTAL2', title='Index selection', options=['CRYPTOCAP:TOTAL2', 'CRYPTOCAP:TOTAL', 'CRYPTOCAP:OTHERS', 'CRYPTOCAP:USDT', 'CRYPTOINDEX:CIX100', 'CRYPTOCAP:BTC.D', 'CRYPTOCAP:BTC'])
IndexHTF = input.string('120', title='higher time frame reference index', options=['1', '2', '5', '10', '15', '30', '45', '60', '90', '120', '150', '240', '360', '720', 'D', '3D', 'W', 'M'])
switchColor = input(true, 'Color Hull according to trend?')
ref = request.security(IndexSwitch, IndexHTF, close[1], lookahead=barmerge.lookahead_on)
RSI_ref = ta.rsi(ref, len)
RSI_close = ta.rsi(close, len)
relative = RSI_ref / RSI_close
plot(relative, color=color.new(color.blue, 0))
long = ta.crossover(relative, correlationcrossover)
short = ta.crossunder(relative, correlationcrossover)
corr = plot(correlationcrossover, color=color.new(color.green, 0), linewidth=1)
hullColor = switchColor ? relative > correlationcrossover ? #00ff00 : #ff0000 : #ff9800

//PLOT
///< Frame
Fi1 = plot(relative, title='relative', color=hullColor, linewidth=1, transp=50)
fill(Fi1, corr, title='Band Filler', color=hullColor, transp=50)

if long and testPeriod()
    strategy.entry("long", strategy.long)

if short and testPeriod()
    strategy.entry("long", strategy.short)

// alertcondition(long, title='long', message='long')
// alertcondition(short, title='short', message='short')