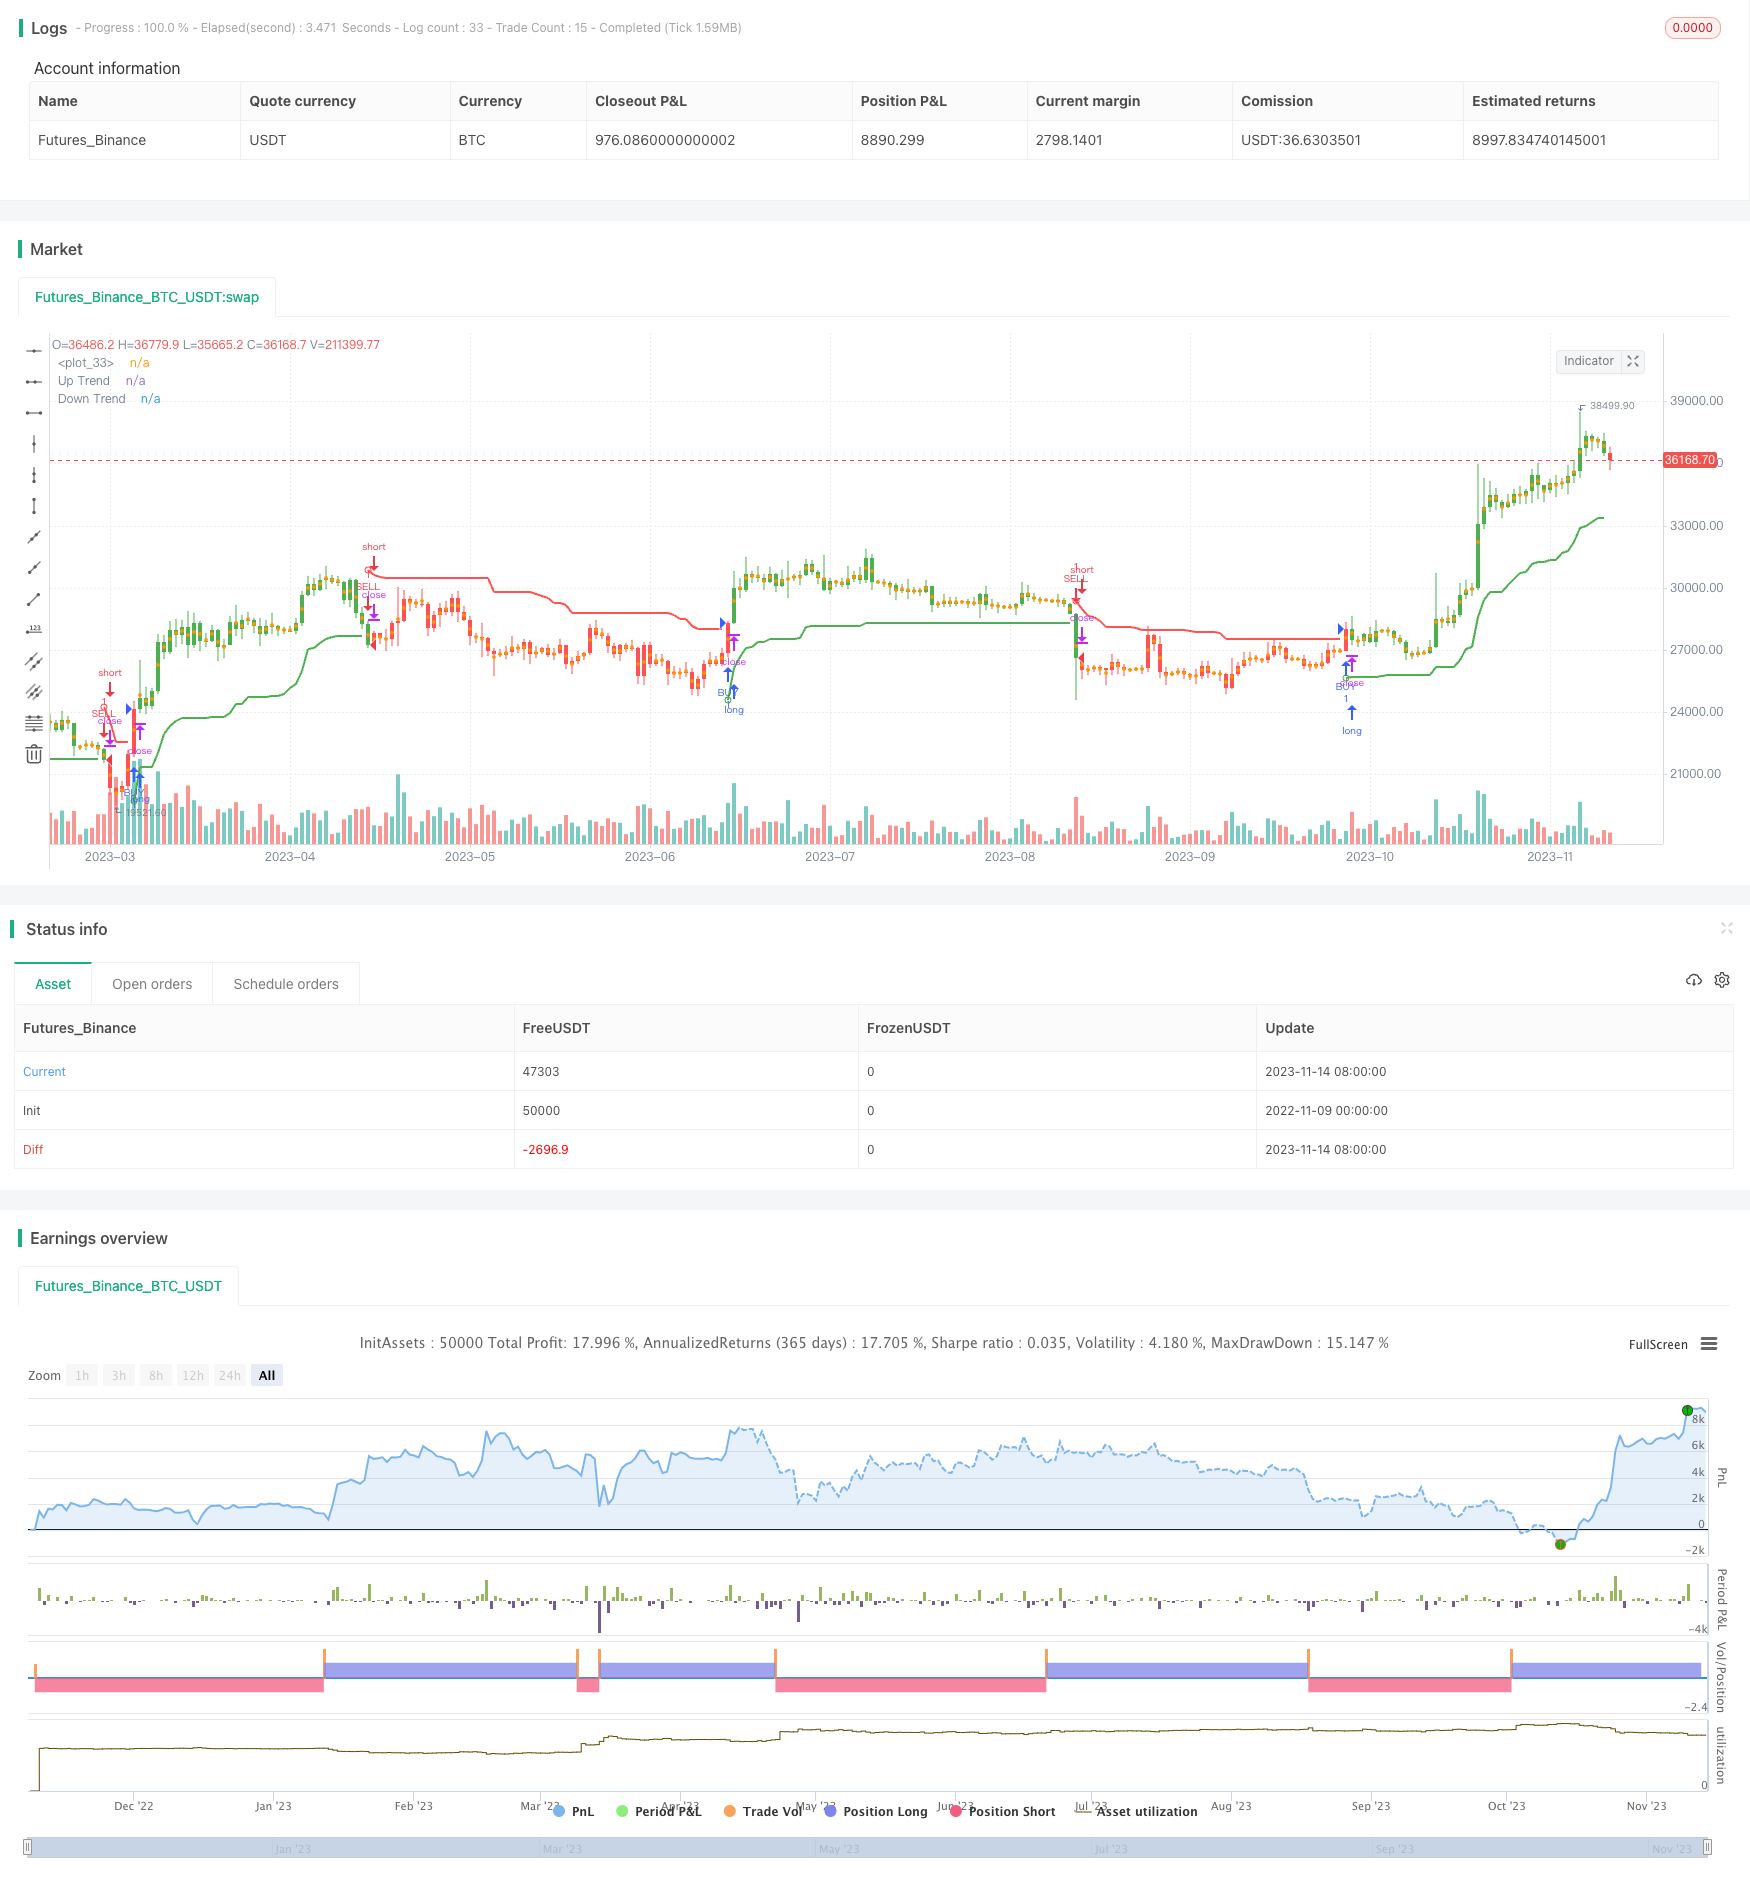
概述
本策略通过双向移动平均线构建多空信号,实现追踪止损,其核心思想是使用移动平均线判断趋势方向,在趋势方向做多做空,并使用ATR计算止损位,实现追踪止损。
策略原理
本策略使用hl2作为源价格,计算一定周期的ATR作为止损幅度。根据ATR值乘以特定倍数计算上轨和下轨。当价格上穿上轨时产生买入信号做多,当价格下穿下轨时产生卖出信号做空。
在开仓后,根据ATR的实时变化调整止损位,实现止损追踪。具体来说,当做多之后,下轨根据最新低点不断上调,实现止损追踪;当做空之后,上轨根据最新高点不断下调,实现止损追踪。
这样,本策略充分利用了移动平均线判断趋势方向的功能,又增加了基于ATR的止损追踪机制,既保证了交易方向的正确性,也控制了交易风险。
策略优势
本策略最大的优势在于风险控制。传统的移动平均线策略只考虑方向判断,很容易爆仓。而本策略加入ATR计算的追踪止损,可以根据市场波动幅度动态调整止损位,有效控制交易风险。
此外,本策略融合多空双向交易。相比单边策略,能够在趋势转折时及时调整仓位方向,避免被困在同一方向,提高策略收益。
策略风险
本策略主要风险在于ATR周期和倍数的设置。如果ATR周期过短或倍数过大,止损幅度将过小,无法有效控制风险;如果ATR周期过长或倍数过小,则止损过于宽松,难以获利。此外,价格突破移动平均线触发建仓信号时,也可能出现假突破的风险。
可以通过优化参数周期和倍数,平衡止损收益;结合其他指标过滤假突破,提高信号质量,降低风险。
优化方向
本策略可以从以下几个方面进行优化:
优化移动平均线周期,寻找最佳参数组合
增加其他指标过滤,如MACD、KDJ等,提高信号质量
增加仓位管理策略,如固定份额、马丁格尔等,提高策略收益
可以研究不同品种的参数差异,进行参数优化
可以结合机器学习方法如遗传算法等对参数进行训练优化
总结
本策略全面考虑了趋势判断和风险控制,在追求收益的同时注重降低回撤。通过参数优化和组合等方法,可以将策略收益进一步提升。总的来说,本策略思路明确,易于实施,是一种可靠稳定的量化交易策略。
/*backtest
start: 2022-11-09 00:00:00
end: 2023-11-15 00:00:00
period: 1d
basePeriod: 1h
exchanges: [{"eid":"Futures_Binance","currency":"BTC_USDT"}]
*/

// This source code is subject to the terms of the Mozilla Public License 2.0 at https://mozilla.org/MPL/2.0/
// © KivancOzbilgic


//@version=4
strategy("Trenbolone Strategy", overlay = true)
Periods = input(title="ATR Period", type=input.integer, defval=10)
src = input(hl2, title="Source")
Multiplier = input(title="ATR Multiplier", type=input.float, step=0.1, defval=3.0)
changeATR= input(title="Change ATR Calculation Method ?", type=input.bool, defval=true)
showsignals = input(title="Show Buy/Sell Signals ?", type=input.bool, defval=false)
highlighting = input(title="Highlighter On/Off ?", type=input.bool, defval=true)
barcoloring = input(title="Bar Coloring On/Off ?", type=input.bool, defval=true)
atr2 = sma(tr, Periods)
atr= changeATR ? atr(Periods) : atr2
up=src-(Multiplier*atr)
up1 = nz(up[1],up)
up := close[1] > up1 ? max(up,up1) : up
dn=src+(Multiplier*atr)
dn1 = nz(dn[1], dn)
dn := close[1] < dn1 ? min(dn, dn1) : dn
trend = 1
trend := nz(trend[1], trend)
trend := trend == -1 and close > dn1 ? 1 : trend == 1 and close < up1 ? -1 : trend
upPlot = plot(trend == 1 ? up : na, title="Up Trend", style=plot.style_linebr, linewidth=2, color=color.green)
buySignal = trend == 1 and trend[1] == -1
plotshape(buySignal ? up : na, title="UpTrend Begins", location=location.absolute, style=shape.circle, size=size.tiny, color=color.green, transp=0)
plotshape(buySignal and showsignals ? up : na, title="Buy", text="Buy", location=location.absolute, style=shape.labelup, size=size.tiny, color=color.green, textcolor=color.white, transp=0)
dnPlot = plot(trend == 1 ? na : dn, title="Down Trend", style=plot.style_linebr, linewidth=2, color=color.red)
sellSignal = trend == -1 and trend[1] == 1
plotshape(sellSignal ? dn : na, title="DownTrend Begins", location=location.absolute, style=shape.circle, size=size.tiny, color=color.red, transp=0)
plotshape(sellSignal and showsignals ? dn : na, title="Sell", text="Sell", location=location.absolute, style=shape.labeldown, size=size.tiny, color=color.red, textcolor=color.white, transp=0)
mPlot = plot(ohlc4, title="", style=plot.style_circles, linewidth=0)
longFillColor = highlighting ? (trend == 1 ? color.green : color.white) : color.white
shortFillColor = highlighting ? (trend == -1 ? color.red : color.white) : color.white
fill(mPlot, upPlot, title="UpTrend Highligter", color=longFillColor)
fill(mPlot, dnPlot, title="DownTrend Highligter", color=shortFillColor)
FromMonth = input(defval = 9, title = "From Month", minval = 1, maxval = 12)
FromDay   = input(defval = 1, title = "From Day", minval = 1, maxval = 31)
FromYear  = input(defval = 2018, title = "From Year", minval = 999)
ToMonth   = input(defval = 1, title = "To Month", minval = 1, maxval = 12)
ToDay     = input(defval = 1, title = "To Day", minval = 1, maxval = 31)
ToYear    = input(defval = 9999, title = "To Year", minval = 999)
start     = timestamp(FromYear, FromMonth, FromDay, 00, 00)
finish    = timestamp(ToYear, ToMonth, ToDay, 23, 59)
window()  => time >= start and time <= finish ? true : false
longCondition = buySignal
if (longCondition)
    strategy.entry("BUY", strategy.long, when = window())
shortCondition = sellSignal
if (shortCondition)
    strategy.entry("SELL", strategy.short, when = window())
buy1 = barssince(buySignal)
sell1 = barssince(sellSignal)
color1 = buy1[1] < sell1[1] ? color.green : buy1[1] > sell1[1] ? color.red : na
barcolor(barcoloring ? color1 : na)