Ichimoku Kinko Hyo Trading Strategy

Overview
The Ichimoku Kinko Hyo trading strategy is a trend-following strategy based on the Ichimoku technical indicator. It uses the conversion line, base line, leading span 1, leading span 2 and other indicators of the Ichimoku system to determine trend direction and timing of entry and exit.
Strategy Logic
The strategy mainly judges the following four conditions to decide the trading direction:
- Go long when the closing price crosses above the 26-period average of the top of the cloud
- Go short when the closing price crosses below the 26-period average of the bottom of the cloud
- Take profit condition: 3.5%
- Stop loss condition: 1.5%
Specifically, the strategy first calculates the conversion line, base line, leading span 1 and leading span 2. It then determines whether to go long or short based on if the closing price breaks through the top or bottom of the cloud.
If the closing price crosses above the top of the cloud, i.e. above the 26-period average of the greater value between leading span 1 and leading span 2, it indicates an upward trend and goes long.
If the closing price crosses below the bottom of the cloud, i.e. below the 26-period average of the lower value between leading span 1 and leading span 2, it indicates a downward trend and goes short.
After entry, take profit and stop loss conditions are set. Take profit is set at 3.5% of entry price and stop loss is 1.5% of entry price.
Advantage Analysis
The Ichimoku Kinko Hyo trading strategy has the following advantages:
- Ability to identify trend changes early and enter trends in a timely manner
- Using the cloud to determine support and resistance areas makes entries more accurate
- Considers both price and volume to avoid false breakouts
- Clear profit taking and stop loss conditions to control trading risk
Risk Analysis
The Ichimoku Kinko Hyo trading strategy also has some risks:
- It can produce multiple small losses in range-bound markets
- Stop loss can be large if the major trend reverses
- Needs multiple conditions to be met which reduces opportunities
- Incorrect parameter settings may misinterpret indicator signals
Solutions:
- Relax entry conditions to increase opportunities
- Optimize parameters to fit market characteristics better
- Add filters with other indicators to avoid false signals
Optimization Directions
The Ichimoku Kinko Hyo trading strategy can be optimized in the following aspects:
- Optimize conversion line, base line and other parameters to fit different period market conditions
- Optimize entry conditions to capitalize on more opportunities
- Optimize take profit and stop loss strategies for higher risk-adjusted returns
- Add filters with other indicators to reduce whipsaws
- Dynamically adjust position sizing based on market volatility
Summary
The Ichimoku Kinko Hyo trading strategy is an overall relatively good strategy that can capture potential trends in a timely manner. But it still needs further optimization and combination with other indicators to form a robust trading system. By adjusting parameters, improving entry and exit techniques, and controlling risks, Ichimoku strategy can achieve higher risk-adjusted returns in trending markets.
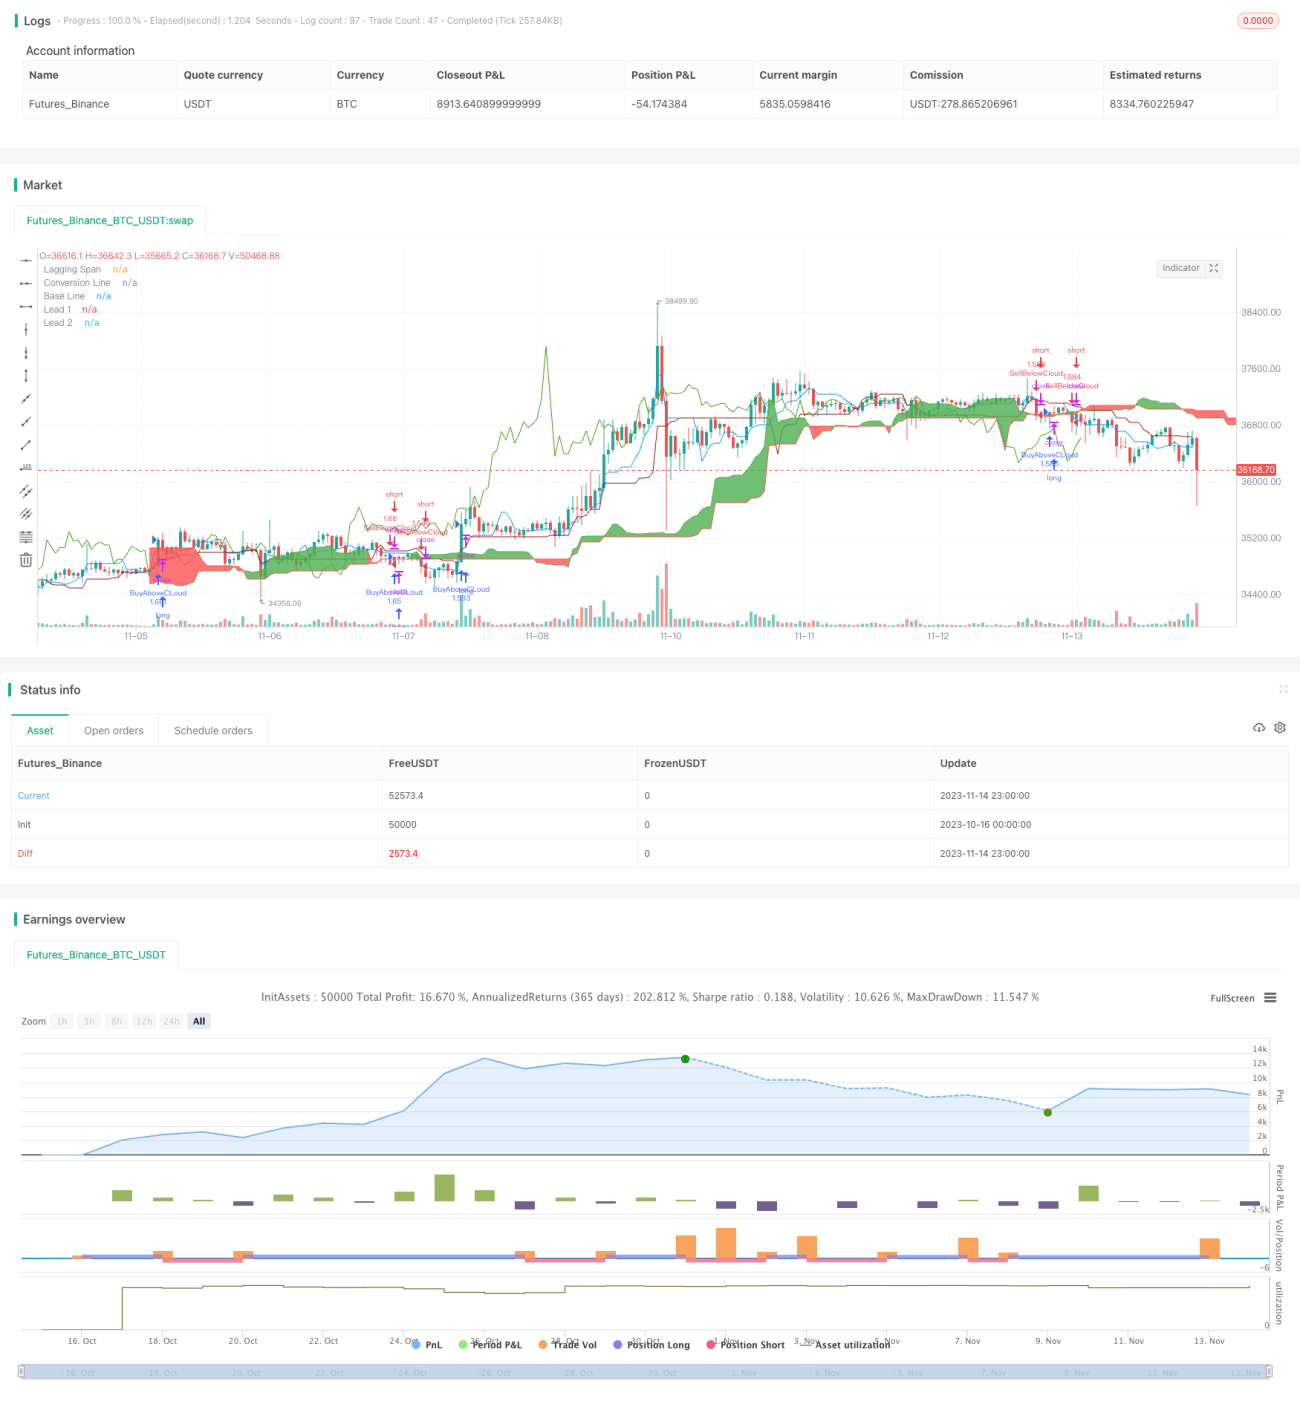
/*backtest
start: 2023-10-16 00:00:00
end: 2023-11-15 00:00:00
period: 1h
basePeriod: 15m
exchanges: [{"eid":"Futures_Binance","currency":"BTC_USDT"}]
*/

//@version=4
strategy("Ichimoku system", overlay=true, initial_capital = 100000, default_qty_type = strategy.percent_of_equity, default_qty_value=100)

buyOnly = input(false, "only shows buying Trade", type = input.bool)- 1