Multiple Trend Tracking Strategy

Overview
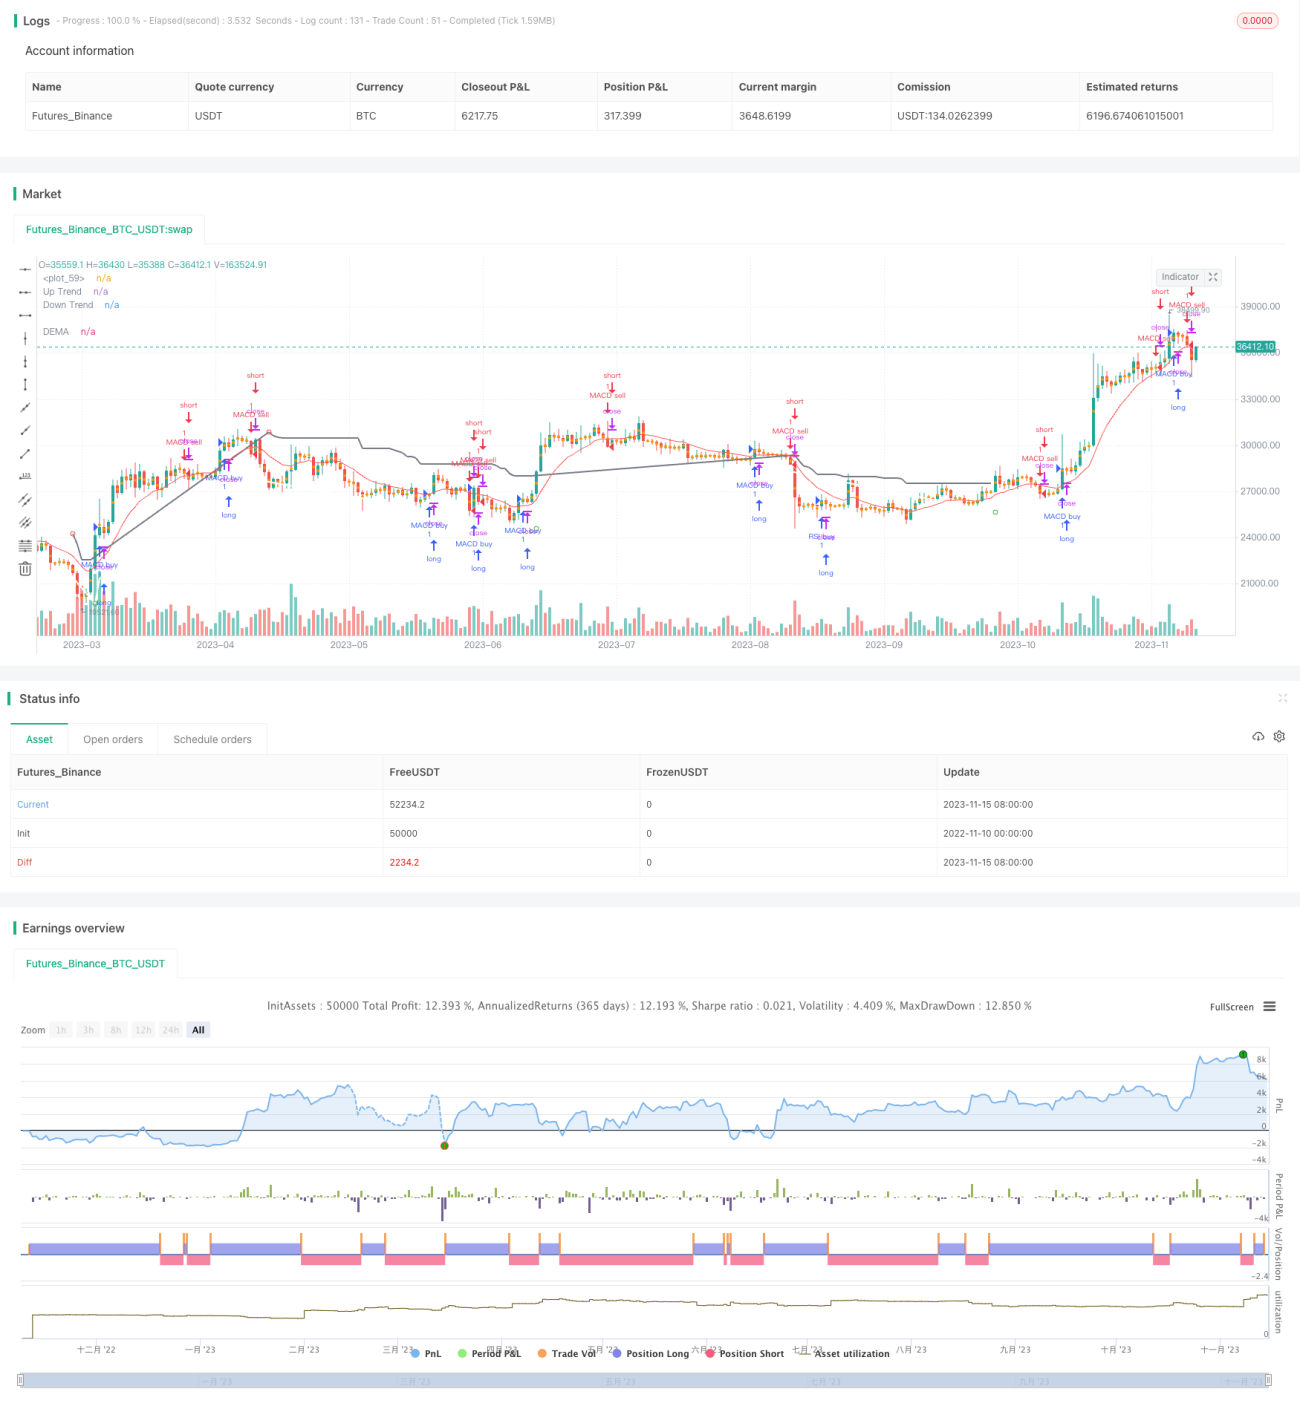
The multiple trend tracking strategy comprehensively utilizes MACD, RSI, ATR and DEMA four indicators to identify the long and short term trends of stocks and conduct trend tracking trading. This strategy combines the advantages of breakout trading and trend tracking trading, which can capture longer-term trends while finding better entry points in the short term.
Strategy Logic
MACD Trading Strategy
MACD stands for Moving Average Convergence Divergence, which is a trend-following indicator. MACD consists of a fast moving average line and a slow moving average line, commonly using parameters of 12-day EMA for fast line, 26-day EMA for slow line, and signal line as 9-day EMA of MACD. When MACD crosses above signal line, it's a buy signal, and when crosses below, it's a sell signal. This strategy uses MACD golden cross and dead cross to determine the trend direction.
RSI Overbought Oversold Strategy
RSI stands for Relative Strength Index, which reflects the overbought and oversold status of a stock. RSI determines whether a stock is overbought or oversold by comparing the average gain and average loss over a period of time.
Advantage Analysis
This strategy comprehensively utilizes MACD, RSI, ATR and DEMA four indicators, taking into account both trend tracking and breakout trading, which can find better entry points within the trend. The main advantages are:
-
MACD can effectively identify the direction and turning points of medium and long-term trends of stock prices.
-
RSI can judge whether a stock is overbought or oversold in the short term to avoid chasing highs and selling lows at trend reversal points.
-
ATR dynamically adjusts the stop loss position to effectively control single loss.
-
DEMA serves as an auxiliary judgment indicator to filter out some noise.
-
The combination of multiple indicators can improve the reliability of trading signals.
Risk Analysis
There are also some risks in this strategy:
-
Divergence may occur with multiple indicators combination, leading to wrong trading signals.
-
ATR as a dynamic stop loss indicator is prone to be broken in large fluctuations resulting in losses.
-
DEMA as a trend filter may filter some stronger short-term trading opportunities.
-
Improper strategy parameters may lead to frequent trading, increasing transaction costs and slippage losses.
To control risks, indicators parameters can be adjusted accordingly. More auxiliary judgment indicators can also be introduced for confirmation. Developing quantitative trading strategies requires meticulous analysis of historical data, robust backtesting, and prudent risk management. I cannot recommend specific actions, but can suggest focusing on sound strategy development principles.
Optimization Directions
The strategy can also be optimized in the following aspects:
-
Test different parameter combinations to find the optimal parameters.
-
Add stop loss strategies like moving stop loss, average stop loss etc. to further control risks.
-
Introduce more auxiliary judgment indicators like KDJ, Bollinger Bands etc. to improve signal accuracy.
-
Optimize entry timing selections by combining breakout strategies to find better entry points.
-
Differentiate parameters for bull and bear markets.
-
Build models by stock characteristics to improve adaptability.
Summary
The multiple trend tracking strategy integrates MACD, RSI, ATR and DEMA four indicators, achieving organic combination of trend tracking and trend breakout. Compared with single indicator strategies, this strategy can provide more reliable trading signals and avoid certain false signals. Through parameter optimization, stop loss strategies, auxiliary judgements etc., the strategy performance can be further improved. This strategy is suitable for quantitative trading requiring higher trend switching capabilities and is a promising strategy idea worth long-term tracking and optimization.
- 1