Dual Moving Average Crossover Strategy

Overview
The Dual Moving Average Crossover Strategy is a typical trend following strategy. It calculates two moving averages with different periods and uses their crossover as trading signals to capture the direction and momentum of market trends.
Strategy Logic
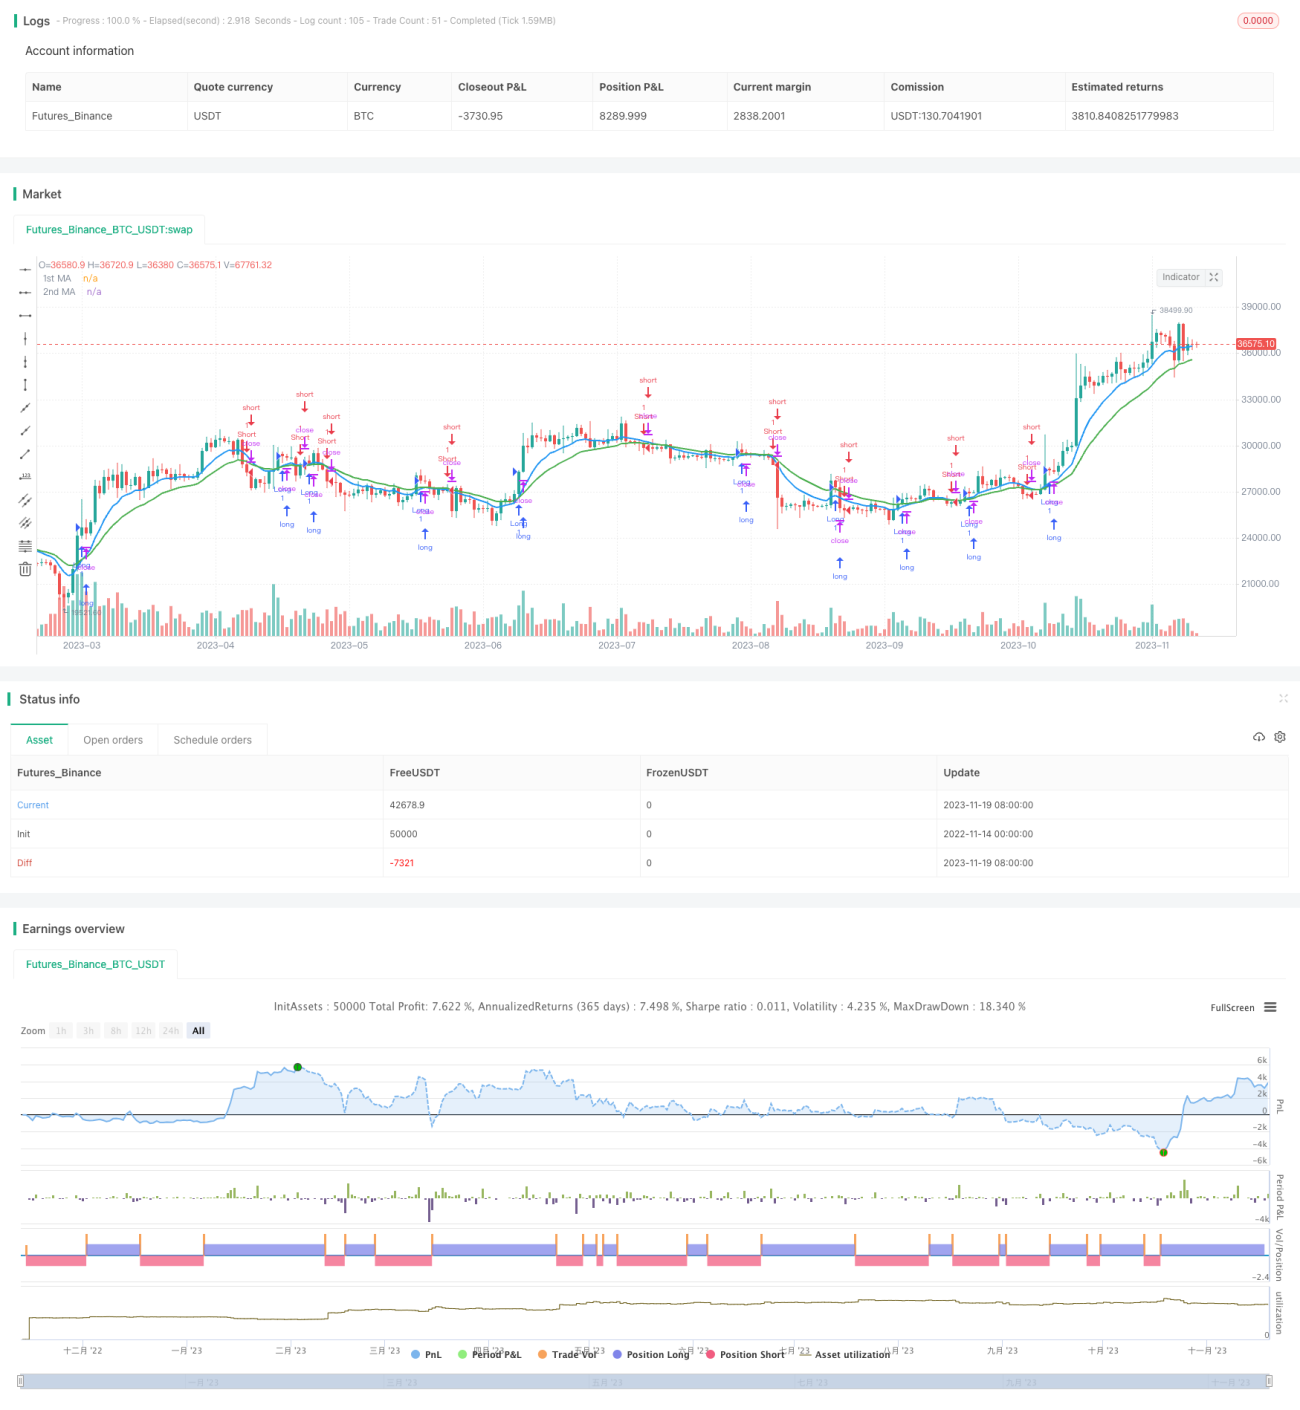
The strategy is mainly based on two moving averages. The first moving average has a shorter period and can respond to price changes faster. The second moving average has a longer period and can filter out some noise. When the short term moving average crosses over the long term moving average, it is considered a buy signal. When the short term moving average crosses below the long term moving average, it is considered a sell signal.
Specifically, this strategy calculates a 10-period exponential moving average (price1) and a 20-period exponential moving average (price2). If the open and close prices of the current bar are both higher than the two moving averages, a buy signal is generated. If the open and close prices are both lower than the two moving averages, a sell signal is generated.
This design allows earlier entry when a trend starts to form and follows the trend. When the trend reverses, it can also exit the market early to effectively control risks.
Advantages
- Catch trends early and follow strong trends
- Dual MA crossover filters noise
- Double confirmation from open and close prices reduces ineffective trades
Risks
- Prone to whipsaws and reverse trades
- Frequent crossover signals may occur
- Large parameter tuning space may lead to overfitting
Enhancement
- Test different parameter sets to find optimum
- Add stop loss to limit loss size
- Add filters to reduce bad trades
- Combine other indicators to confirm signals
Summary
The strategy is relatively simple and practical, capturing trends with dual MA crossover, making it a fundamental quant strategy. But it also has some risks and needs further optimization for different market regimes. There is room for enhancing parameters, stops, filters etc. to make it more robust.
- 1