概述
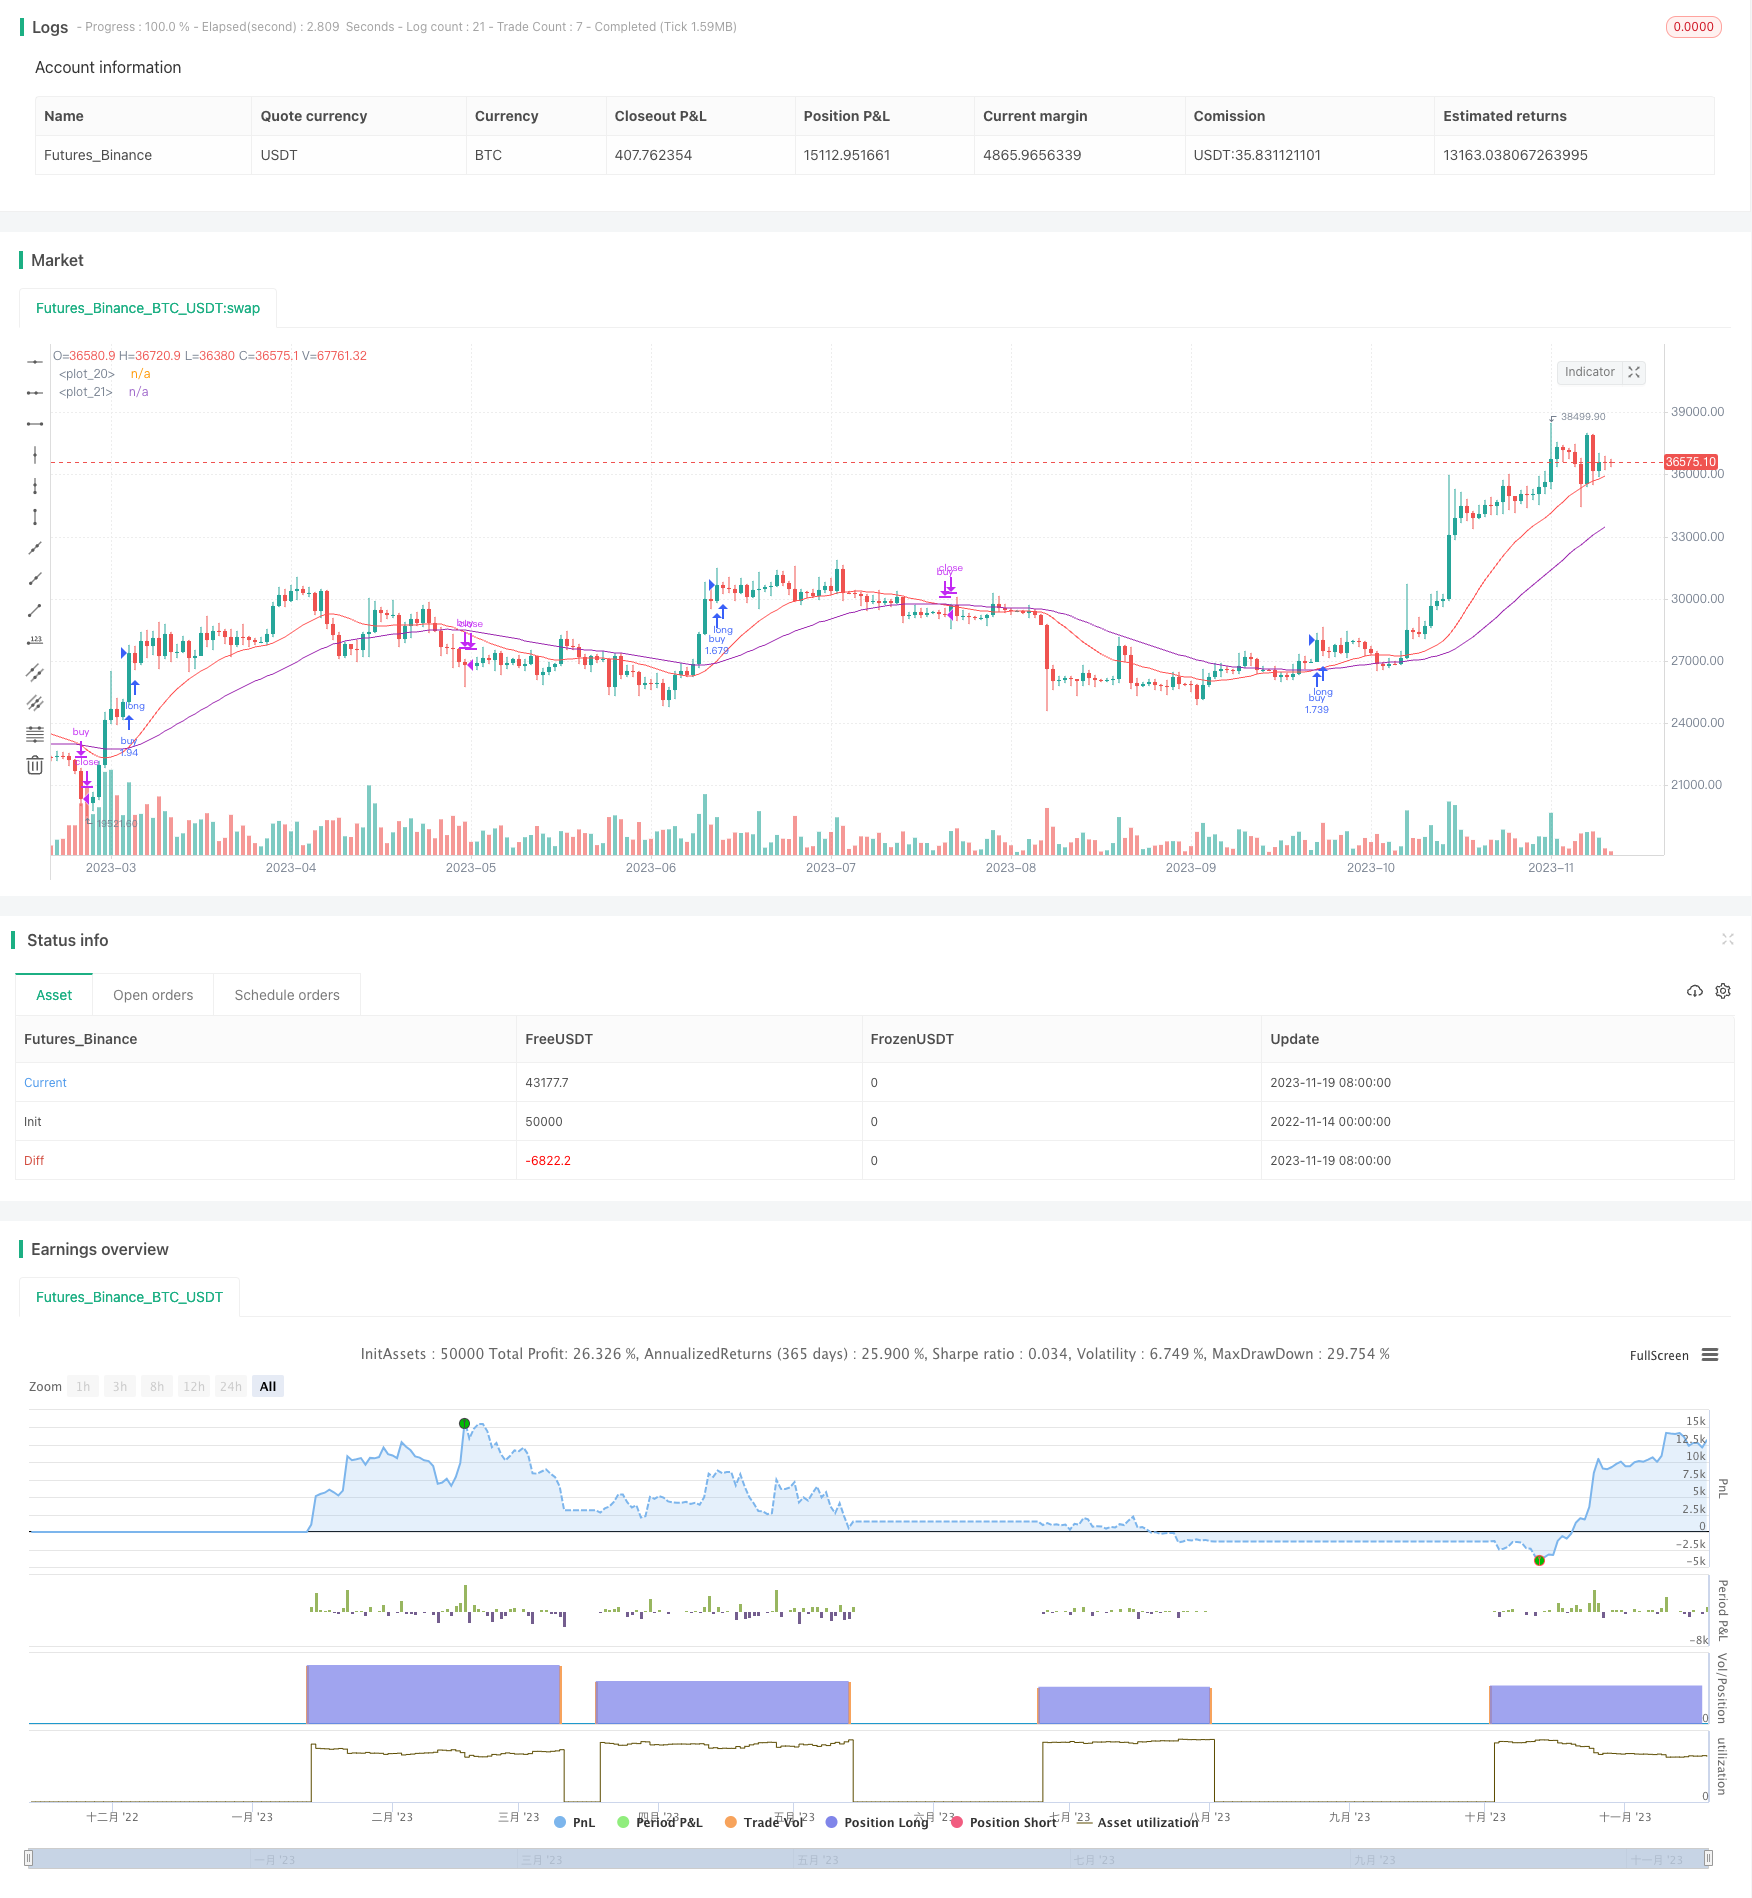
该策略通过计算两个不同周期的EMA均线的交叉来判断市场趋势,并据此产生交易信号。当短周期EMA上穿长周期EMA时,认为市场进入上升趋势,该策略将开仓做多;当短周期EMA下穿长周期EMA时,认为市场进入下降趋势,该策略将平仓退出。
策略原理
该策略主要应用双EMA均线的金叉死叉理论。双EMA均线分为长线EMA和短线EMA。短线EMA参数设置为10天,长线EMA参数设置为21天。
当短线EMA上穿长线EMA时,产生买入信号;当短线EMA下穿长线EMA时,产生卖出信号。该策略同时设置了增长率阈值,只有增长率超过阈值时才会开仓做多,跌幅超过阈值时才会平仓。
具体来说,买入条件为短线EMA高于长线EMA,且股价增长率超过设定的正阈值;平仓条件为短线EMA低于长线EMA,且股价增长率低于设定的负阈值。
策略优势
- 利用双EMA均线的金叉死叉理论,相对简单可靠
- 增加增长率阈值设定,避免增长乏力时错误交易
- 可严格控制最大损失比例
- 可灵活调整EMA均线参数,适用于不同周期
风险分析
- EMA均线具有滞后性,可能错过价格反转点
- 均线交叉具有一定迟滞性,可能导致失去最佳开仓时机
- 需依赖参数优化,参数设定不当可能导致交易频繁或信号不足
优化方向
- 结合其他指标进行优化,如MACD,KD等,提高信号准确率
- 增加止损策略,如跟踪止损,确保利润最大化
- 优化EMA周期参数,针对不同品种设定最佳参数
- 结合实时数据与机器学习方法进行动态参数调整优化
总结
本策略整体较为简单可靠,通过双EMA交叉判断价格趋势,并设定增长率阈值发出交易信号。相比单一均线交叉,可过滤部分假信号。但EMA均线本身存在滞后性问题,结合其他指标或动态调参可进一步提升策略效果。
策略源码
/*backtest
start: 2022-11-14 00:00:00
end: 2023-11-20 00:00:00
period: 1d
basePeriod: 1h
exchanges: [{"eid":"Futures_Binance","currency":"BTC_USDT"}]
*/

//@version=3
strategy(title="ema(ema10-21)", overlay=true, pyramiding = 0, default_qty_type = strategy.percent_of_equity, default_qty_value = 100, initial_capital = 15000, commission_type = strategy.commission.percent, commission_value = 0.2)

useTimeLimit    = input(defval = false, title = "Use Start Time Limiter?")
startYear       = input(defval = 2016, title = "Start From Year",  minval = 0, step = 1)
startMonth      = input(defval = 05, title = "Start From Month",  minval = 0,step = 1)
startDay        = input(defval = 01, title = "Start From Day",  minval = 0,step = 1)
startHour       = input(defval = 00, title = "Start From Hour",  minval = 0,step = 1)
startMinute     = input(defval = 00, title = "Start From Minute",  minval = 0,step = 1)

startTimeOk() => true

lenght0 = input(10)
lenght1 = input(21)

source = close

EmaShort = ema(ema(source, lenght0), lenght0)
EmaLong = ema(ema(source, lenght1),lenght1)
plot(EmaShort, color=red)
plot(EmaLong, color=purple)

growth = ((EmaShort-EmaLong)*100)/((EmaShort+EmaLong)/2)
thresholdUp = input(defval=0.05, title="Threshold Up", type=float, step=0.01)
thresholdDown = input(defval=-0.165, title="Threshold Down", type=float, step=0.001)

if( startTimeOk() )
    buy_condition = EmaShort > EmaLong and growth > thresholdUp
    buy_exit_condition = EmaShort < EmaLong and growth < thresholdDown
    strategy.entry("buy", strategy.long, comment="buy", when=buy_condition)
    strategy.close(id='buy', when=buy_exit_condition)