概述
本策略结合了移动平均线指标、布林带指标和成交量加权平均价指标,在金叉形成、短均线上穿长均线的条件下判断进入。策略还利用布林带通道,仅在价格触及布林带下轨时才考虑入场,从而避免在行情震荡中频繁进出。
策略原理
该策略主要通过均线指标判断趋势方向,利用布林带来定位波动区间选择买点。具体来说,策略包含以下几个关键规则:
使用50日EMA和200日EMA构建金叉判断系统,当快速移动平均线上穿慢速移动平均线时认为处于多头上升趋势;
价格大于VWAP时,认为处于价格上升阶段,有利于建仓做多;
价格刚刚触及或突破布林带下轨时,表明股价可能处于反弹点附近,机会较好;
进入多头持仓后,价格超过布林带上轨时及时止盈退出。
通过这几个规则的组合,使得本策略在牛市行情中,能够选择合适的买点买入,并设置止损止盈确保收益。
策略优势
利用金叉判断系统确定大趋势方向,避免在震荡行情中小胜小负;
VWAP指标可判断价格波动方向,使买点选择更精准;
布林带指标判断买点使策略更有韧性,同时设置止损止盈以锁定收益;
多种指标相互验证,使策略判断更加准确可靠。
策略风险及解决方法
金叉判断系统可能发出假信号,应适当缩短均线周期长度,并配合其他指标验证;
布林带参数设置不当也会使策略失去效用,应调节布林带周期及标准差参数;
停损点设置过于宽松,无法有效控制亏损。应适当收紧止损范围,确保风险可控。
策略优化方向
优化金叉均线组合,测试不同均线参数,找到最佳参数;
测试不同周期布林带参数,找到幅度及离散性最好的参数组合;
测试并优化止损范围,使之既能有效控制风险,又不至于过于容易被触发。
总结
本策略综合运用均线系统、布林带以及VWAP指标判断入场时机,在兼顾发现机会与控制风险上做出了平衡。通过后续参数优化及规则修正,有望锁定行业及市场中的持续良机。
策略源码
/*backtest
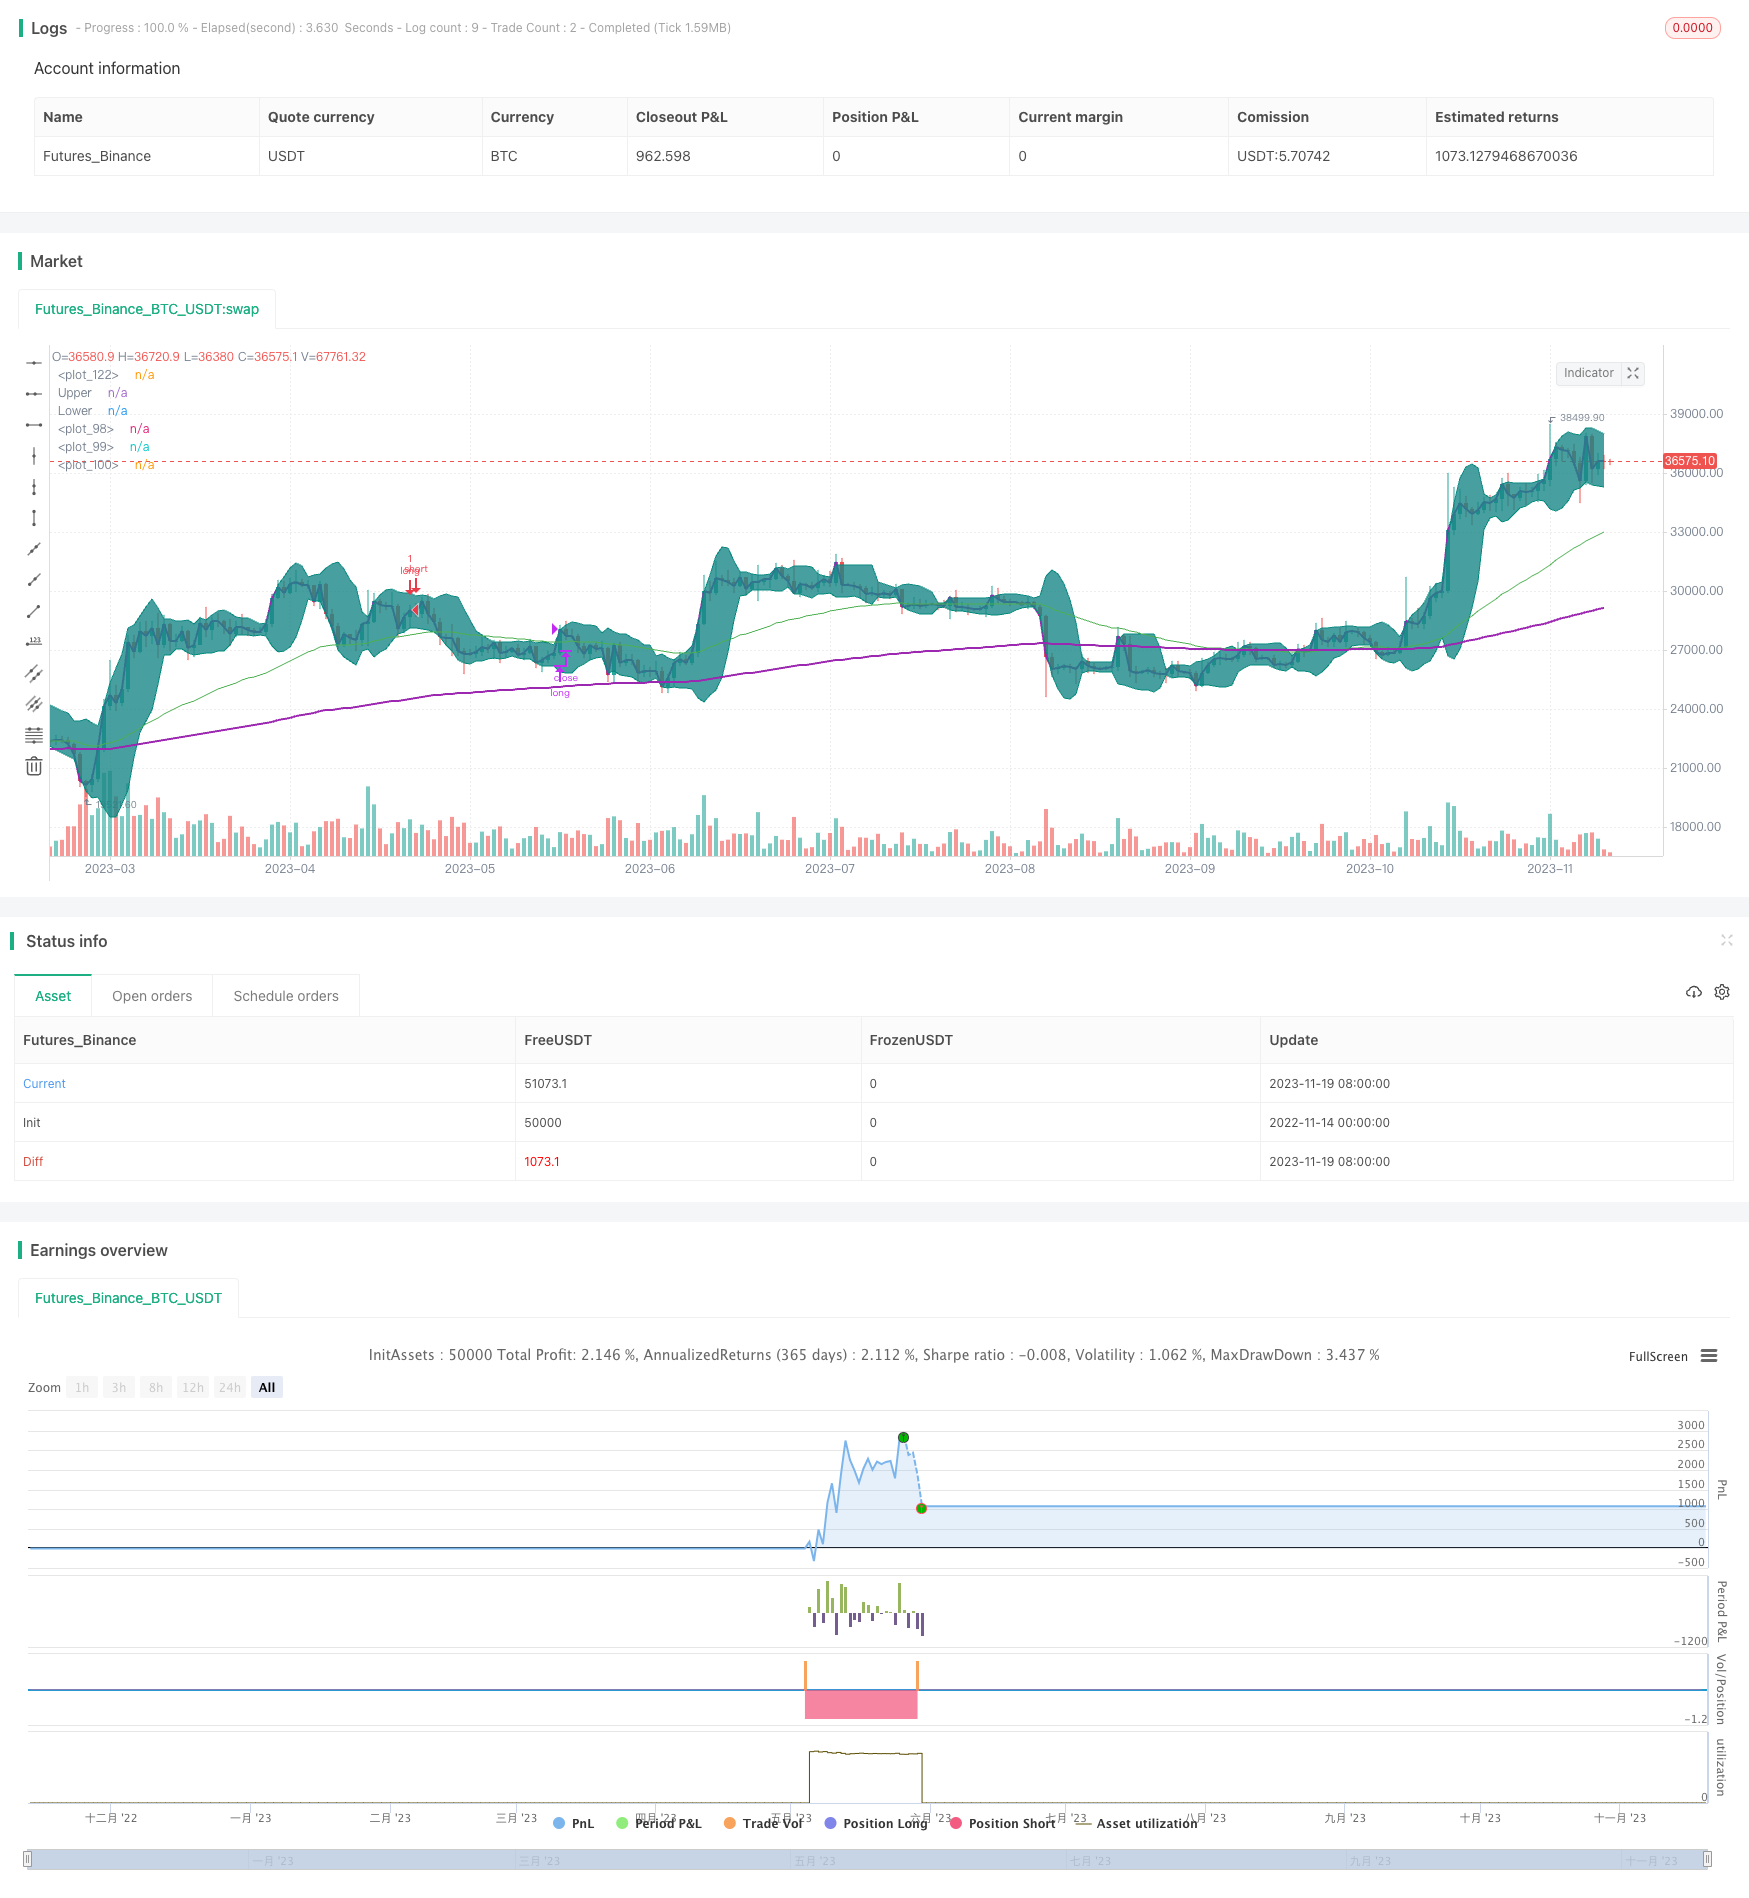
start: 2022-11-14 00:00:00
end: 2023-11-20 00:00:00
period: 1d
basePeriod: 1h
exchanges: [{"eid":"Futures_Binance","currency":"BTC_USDT"}]
*/
// This source code is subject to the terms of the Mozilla Public License 2.0 at https://mozilla.org/MPL/2.0/
// © mohanee
//@version=4
strategy(title="VWAP and BB strategy [$$]", overlay=true,pyramiding=2, default_qty_value=1, default_qty_type=strategy.fixed, initial_capital=10000, currency=currency.USD)
fromDay = input(defval = 1, title = "From Day", minval = 1, maxval = 31)
fromMonth = input(defval = 6, title = "From Month", minval = 1, maxval = 12)
fromYear = input(defval = 2020, title = "From Year", minval = 1970)
// To Date Inputs
toDay = input(defval = 1, title = "To Day", minval = 1, maxval = 31)
toMonth = input(defval = 8, title = "To Month", minval = 1, maxval = 12)
toYear = input(defval = 2020, title = "To Year", minval = 1970)
// Calculate start/end date and time condition
DST = 1 //day light saving for usa
//--- Europe
London = iff(DST==0,"0000-0900","0100-1000")
//--- America
NewYork = iff(DST==0,"0400-1300","0500-1400")
//--- Pacific
Sydney = iff(DST==0,"1300-2200","1400-2300")
//--- Asia
Tokyo = iff(DST==0,"1500-2400","1600-0100")
//-- Time In Range
timeinrange(res, sess) => time(res, sess) != 0
london = timeinrange(timeframe.period, London)
newyork = timeinrange(timeframe.period, NewYork)
startDate = timestamp(fromYear, fromMonth, fromDay, 00, 00)
finishDate = timestamp(toYear, toMonth, toDay, 00, 00)
time_cond = time >= startDate and time <= finishDate
is_price_dipped_bb(pds,source1) =>
t_bbDipped=false
for i=1 to pds
t_bbDipped:= (t_bbDipped or close[i]<source1) ? true : false
if t_bbDipped==true
break
else
continue
t_bbDipped
is_bb_per_dipped(pds,bbrSrc) =>
t_bbDipped=false
for i=1 to pds
t_bbDipped:= (t_bbDipped or bbrSrc[i]<=0) ? true : false
if t_bbDipped==true
break
else
continue
t_bbDipped
// variables BEGIN
shortEMA = input(50, title="fast EMA", minval=1)
longEMA = input(200, title="slow EMA", minval=1)
//BB
smaLength = input(7, title="BB SMA Length", minval=1)
bbsrc = input(close, title="BB Source")
strategyCalcOption = input(title="strategy to use", type=input.string, options=["BB", "BB_percentageB"], defval="BB")
//addOnDivergence = input(true,title="Add to existing on Divergence")
//exitOption = input(title="exit on RSI or BB", type=input.string, options=["RSI", "BB"], defval="BB")
//bbSource = input(title="BB source", type=input.string, options=["close", "vwap"], defval="close")
//vwap_res = input(title="VWAP Resolution", type=input.resolution, defval="session")
stopLoss = input(title="Stop Loss%", defval=1, minval=1)
//variables END
longEMAval= ema(close, longEMA)
shortEMAval= ema(close, shortEMA)
ema200val = ema(close, 200)
vwapVal=vwap(close)
// Drawings
//plot emas
plot(shortEMAval, color = color.green, linewidth = 1, transp=0)
plot(longEMAval, color = color.orange, linewidth = 1, transp=0)
plot(ema200val, color = color.purple, linewidth = 2, style=plot.style_line ,transp=0)
//bollinger calculation
mult = input(2.0, minval=0.001, maxval=50, title="StdDev")
basis = sma(bbsrc, smaLength)
dev = mult * stdev(bbsrc, smaLength)
upperBand = basis + dev
lowerBand = basis - dev
offset = input(0, "Offset", type = input.integer, minval = -500, maxval = 500)
bbr = (bbsrc - lowerBand)/(upperBand - lowerBand)
//bollinger calculation
//plot bb
//plot(basis, "Basis", color=#872323, offset = offset)
p1 = plot(upperBand, "Upper", color=color.teal, offset = offset)
p2 = plot(lowerBand, "Lower", color=color.teal, offset = offset)
fill(p1, p2, title = "Background", color=#198787, transp=95)
plot(vwapVal, color = color.purple, linewidth = 2, transp=0)
// Colour background
//barcolor(shortEMAval>longEMAval and close<=lowerBand ? color.yellow: na)
//longCondition= shortEMAval > longEMAval and close>open and close>vwapVal
longCondition= ( shortEMAval > longEMAval and close>open and close>vwapVal and close<upperBand ) //and time_cond // and close>=vwapVal
//Entry
strategy.entry(id="long", comment="VB LE" , long=true, when= longCondition and ( strategyCalcOption=="BB"? is_price_dipped_bb(10,lowerBand) : is_bb_per_dipped(10,bbr) ) and strategy.position_size<1 ) //is_price_dipped_bb(10,lowerBand)) //and strategy.position_size<1 is_bb_per_dipped(15,bbr)
//add to the existing position
strategy.entry(id="long", comment="Add" , long=true, when=strategy.position_size>=1 and close<strategy.position_avg_price and close>vwapVal) //and time_cond)
barcolor(strategy.position_size>=1 ? color.blue: na)
strategy.close(id="long", comment="TP Exit", when=crossover(close,upperBand) )
//stoploss
stopLossVal = strategy.position_avg_price * (1-(stopLoss*0.01) )
//strategy.close(id="long", comment="SL Exit", when= close < stopLossVal)
//strategy.risk.max_intraday_loss(stopLoss, strategy.percent_of_equity)