Dual Moving Average Crossover Combined with RSI Indicator Quantitative Trading Strategy

Overview
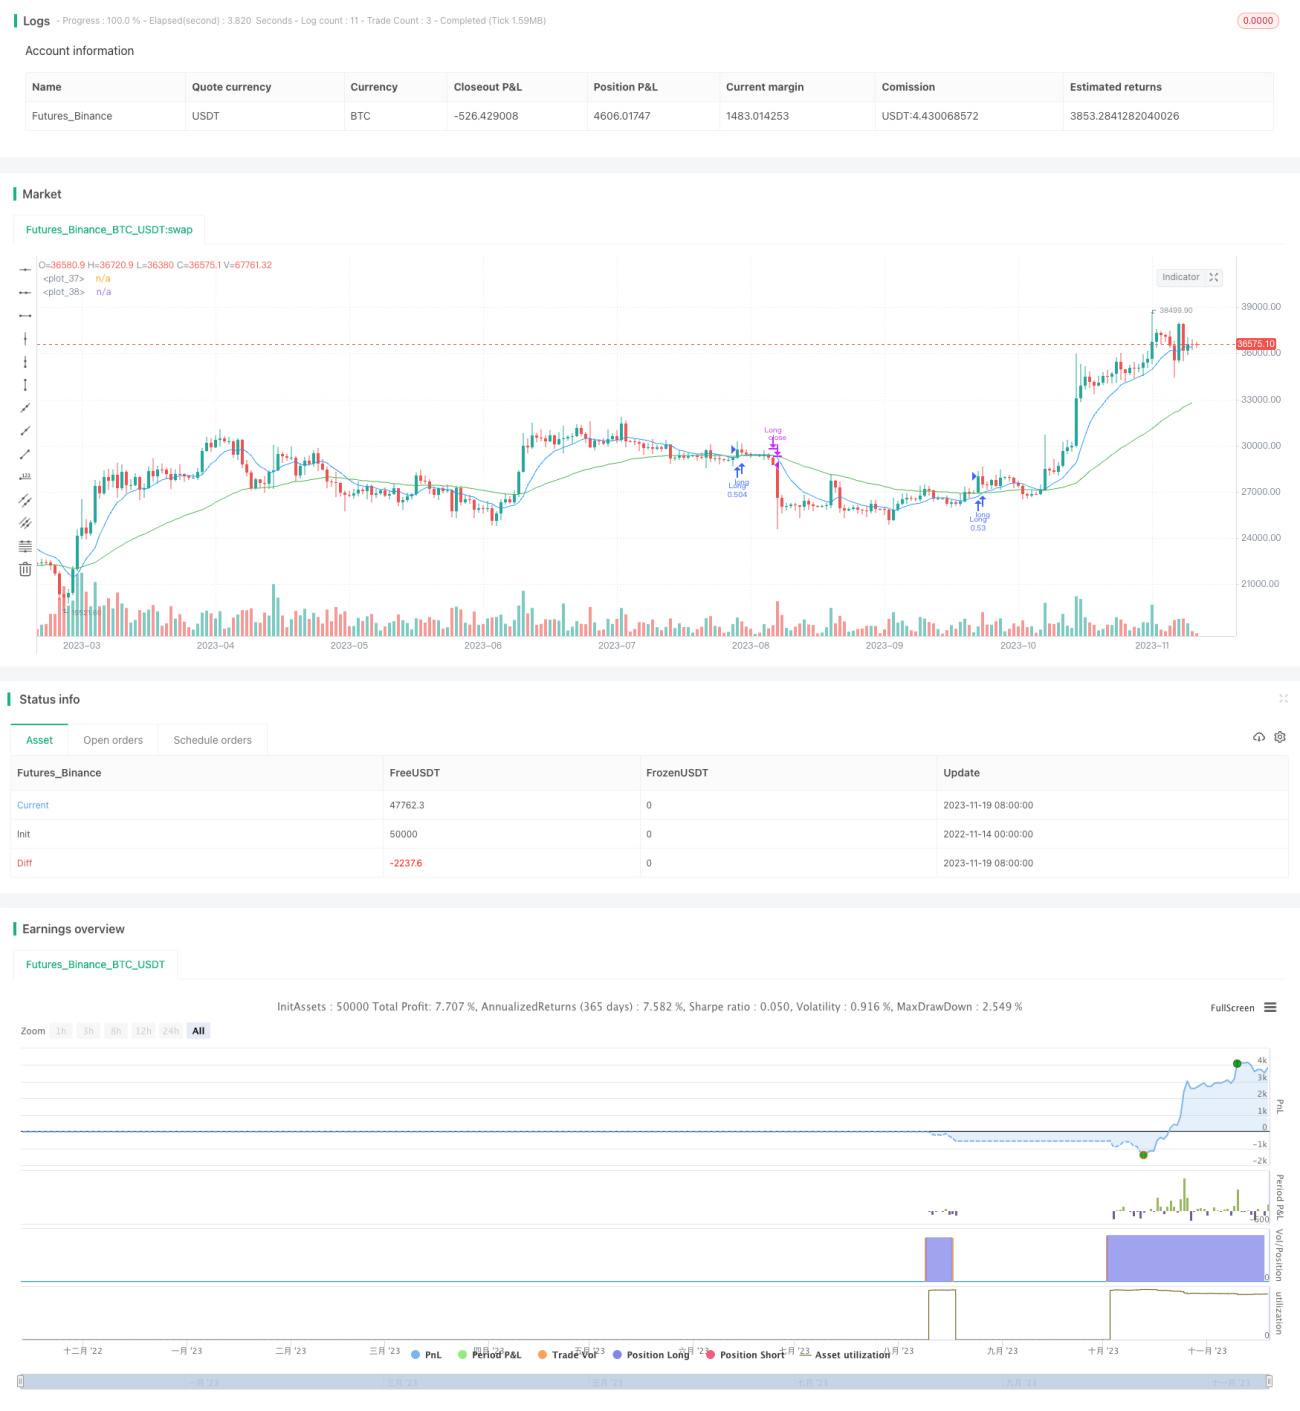
This strategy combines dual moving average crossover and RSI indicator to identify trend direction and overbought/oversold situations. It goes long when the buying conditions are met and closes positions when the selling conditions are triggered. The goal is to use moving average crossover to determine trend direction while utilizing RSI indicator to avoid wrongly buying at tops and selling at bottoms, thus generating better profits.
Strategy Logic
When the fast 9-period moving average crosses above the slow 50-period moving average, it signals an uptrend in shorter timeframe overlapping with an uptrend in longer timeframe, which is a typical bullish signal. Meanwhile, if RSI is greater than the previous period by 5 points and less than 70, it means the asset is approaching but not yet in the overbought territory, making it a good timing to go long.
When the fast 9-period moving average crosses below the slow 50-period moving average, it signals the beginning of a bearish market and existing long positions should be closed.
Advantage Analysis
- Dual moving averages help determine overall market direction and avoid false breakout
- RSI indicator prevents wrong moves at turning points
- Flexibility in adjusting moving average periods to suit different symbols and timeframes
- Controllable stop loss strategy
Risk Analysis
- Crossover signal may lag and cause some losses
- Improper RSI parameter setting may miss best entry timing
- Need to watch trading volume to see if it supports price move
- Black swan events require manual intervention
Optimization Directions
- Optimize RSI parameters for best results
- Incorporate trading volume to avoid false signals
- Test optimal moving average periods based on symbol and timeframe
- Loosen stop loss to avoid being stopped out early
Summary
This strategy utilizes dual moving average crossover to determine direction and RSI to avoid chasing tops and bottoms. It can effectively ride medium- to long-term trends for steady profits. But the lagging nature of crossover signals and tuning of RSI parameters should be watched out for. Also need to correlate price with volume. With continuous testing and optimization, this strategy shows promise for even better results.
- 1