Cross Moving Average Strategy

Overview
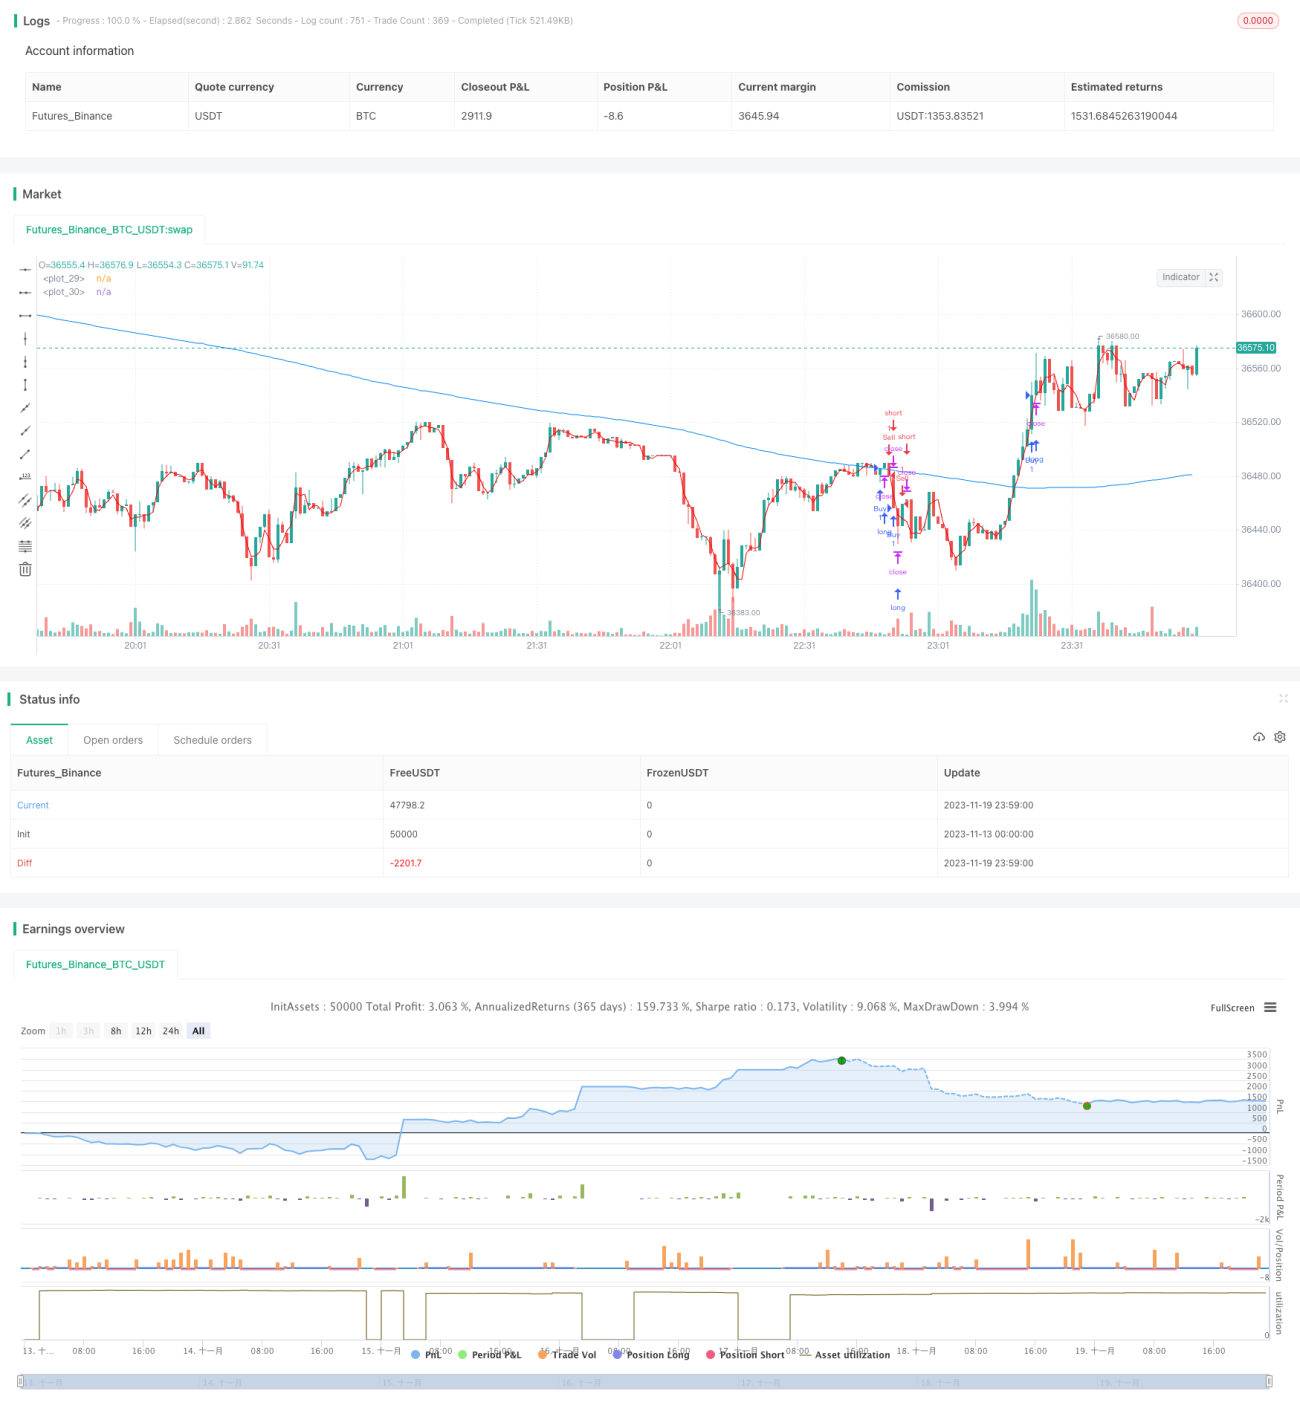
This strategy judges entry and exit points by calculating the golden cross and death cross between fast and slow moving average lines. It goes long when the fast line crosses above the slow line, and goes short when the fast line crosses below the slow line.
Principles
The strategy is mainly based on the golden cross and death cross principles of moving averages. It calculates a fast moving average line with a length of 3 and a slow moving average line with a length of 266. A buy signal is generated when the fast line crosses above the slow line, and a sell signal is generated when the fast line crosses below the slow line. It enters the market on the third candlestick after the signal is received.
The basis for this strategy to judge the trend is that when prices rise, the short-term moving average line moves up faster; when prices fall, the short-term moving average line moves down faster. Thus crossovers between the short-term fast line and the long-term slow line will occur.
Advantage Analysis
The biggest advantage of this strategy is that it uses the golden cross and death cross relationship between moving averages of different cycle lengths to determine trend reversal points. Compared with a single moving average line and other indicators, it can more accurately capture price turns.
Firstly, the fast moving average line can more sensitively capture price changes, while the slow moving average line plays the role of filtering out noise and can effectively identify the trend direction. The two lines work together to avoid generating false signals.
Secondly, the strategy adopts a lagged entry method, i.e. entering the market on the third candlestick after the signal is generated. This can further avoid wrong trades caused by moving average oscillations.
Moreover, the parameter selection is reasonable and simple. It only relies on two moving average lines to complete the judgment, without calculating complex indicators, thus reducing the possibility of over-optimization.
Risk Analysis
Although the strategy has no obvious flaws and risks, several points still need to be noted when used for live trading:
Firstly, relying solely on the moving average as the trend judging indicator may miss trading opportunities identified by other indicators. It is advisable to appropriately include alternative indicators for combined judgment.
Secondly, in a strong trend, prices may run for a long time above or below the fast line. This will result in long periods without signal generation. Parameters need to be adjusted to make the fast line closer to prices.
Also, indicator parameters are not 100% reliable. The optimal parameters may vary across different products and cycle periods. Continual testing and optimization based on live trading feedback are necessities.
Lastly, accurate assessment on trading size, stop loss and take profit levels is also important to avoid excessive losses or failure to take profits timely.
Optimization Directions
There are several major optimization directions for this strategy:
Firstly, consider adding judgment logics from other auxiliary indicators together with golden crosses and death crosses. For example, further confirm trading signals when RSI indicator shows overbought or oversold conditions.
Secondly, parameter optimization is crucial. Comprehensive considerations can be given to cycle, product variety and other factors. Keep testing and adjusting parameters through historical backtests and demo trading to make the strategy more adaptive to market conditions.
Thirdly, optimize entry methods. Apart from simple third candlestick entry, study lagging entry after ‘N’ candlesticks, price spread entry, breakout entry, etc. Details should be fine tuned according to different products and cycle periods.
Lastly, improving stop loss and take profit methods is equally important. Indicators like ATR can be used to dynamically adjust levels of stop loss and take profit. Moreover, trailing stop loss, partial profit taking and other techniques are also worth studying. These will greatly improve the strategy’s profitability.
Conclusion
The strategy utilizes the classic principle of using moving average golden crosses and death crosses to determine future price direction. By reasonably setting parameters to generate trading signals and adopting lagging entry and stop loss/take profit methods to control risks, it is a simple, practical quantitative trading strategy. There remains much potential for further improvement in areas like indicator parameter optimization, indicator system enhancement, entry/exit logic adjustment, etc.
- 1