Dual EMA Williams Indicator Trend Tracking Strategy

Overview
This strategy combines dual EMA indicators and Williams indicators to identify trend direction and track trends when they are strong. The basic idea is:
- Use dual EMA combos to filter out all but the strongest trends
- Williams indicator confirms current overbought/oversold zone
- Combine with RSI indicator to avoid chasing new highs and killing declines
Principles
This strategy utilizes short-term and long-term EMAs from the dual EMA indicator. When the short-term EMA crosses above the long-term EMA an entry signal is generated. When the short-term EMA crosses below the long-term EMA an exit signal is generated. It captures medium and long-term trends using the dual EMA.
In addition, the Williams Indicator is used to identify reversals. The Williams Indicator determines overbought or oversold by looking at periodic highs and lows. Sell signals are generated when overbought. Buy signals are generated when oversold.
The specific logic is:
Long entry: short-term EMA crosses above medium-term EMA and long-term EMA, Williams Indicator shows oversold zone and forms lowest point indicating reversal opportunity.
Short entry: short-term EMA crosses below medium-term EMA and long-term EMA, Williams Indicator shows overbought zone and forms highest point indicating reversal opportunity.
The RSI indicator is also introduced to further confirm trading signals and avoid chasing new highs and killing declines blindly.
Advantages
The biggest advantage of this strategy is using the dual EMA to filter out invalid trends and only track the strongest medium and long-term trends. This filters out noise and reduces invalid trades.
Introducing the Williams Indicator is also very effective. Firstly, it identifies reversal opportunities to close positions in time. Secondly, it further confirms the effectiveness of trend signals.
The combination of dual EMA and Williams allows this strategy to achieve good tracking profit in medium and long-term products, while also identifying reversals and limiting losses.
Risks
The main risk lies in the difficulty of identifying trend reversal points. Although Williams Indicator and RSI Indicator ensure effectiveness of reversal trades, the difficulty is still high and the risk of chasing new highs and killing declines cannot be completely avoided.
In addition, the dual EMA itself has some lag. When the short-term and medium & long-term trends decouple, some identification difficulty can occur.
Optimization
This strategy can be optimized in the following ways:
-
Test more EMA cycle combos to find better parameters
-
Increase adaptive exit mechanisms based on ATR, volatility index etc to judge reversals
-
Introduce machine learning with LSTM etc to predict trends and reversals
-
Improve reversal trading rules using Elliott Wave Theory etc
-
Introduce adaptive position sizing based on market conditions
Conclusion
This strategy successfully combines dual EMA and Williams Indicator to capture medium and long-term trends and achieve higher returns during major trends. Meanwhile, introducing Williams Indicator also allows the strategy to identify reversals and cut losses in time. Next step is to further enhance stability of strategy by introducing more indicators and models for optimization.
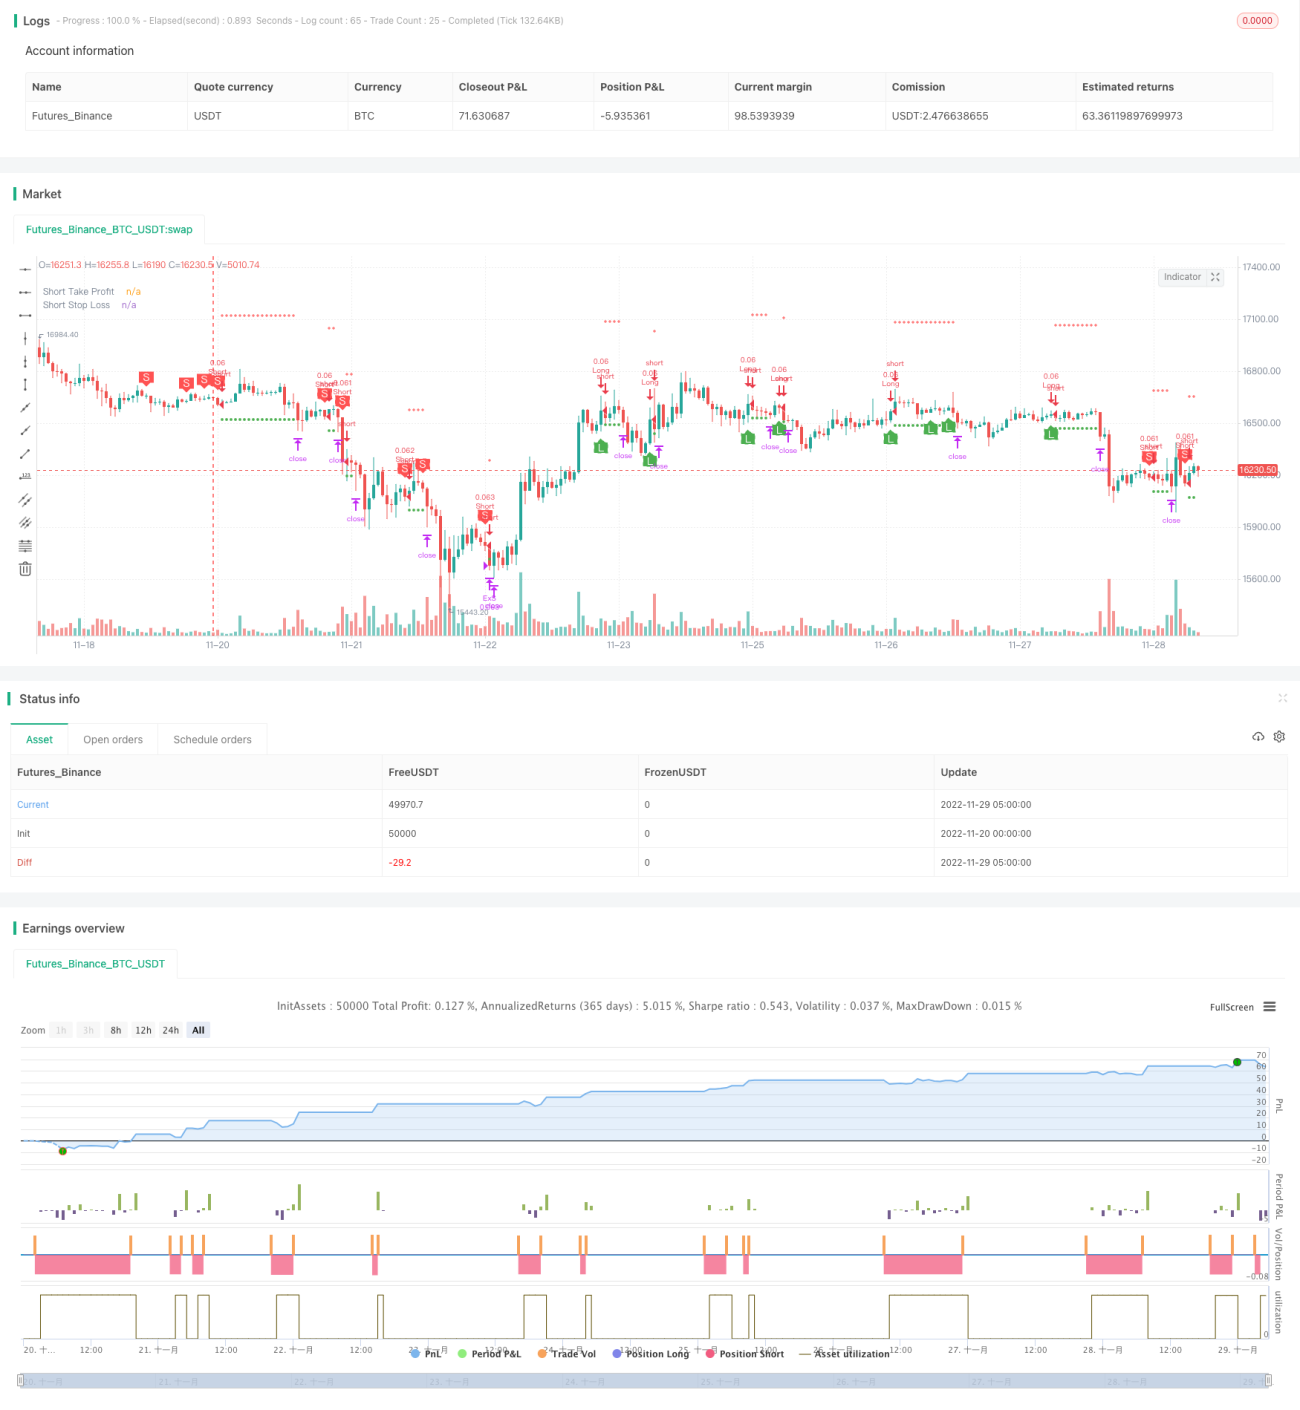
/*backtest
start: 2022-11-20 00:00:00
end: 2022-11-29 05:20:00
period: 1h
basePeriod: 15m
exchanges: [{"eid":"Futures_Binance","currency":"BTC_USDT"}]
*/

// This source code is subject to the terms of the Mozilla Public License 2.0 at https://mozilla.org/MPL/2.0/
// © B_L_A_C_K_S_C_O_R_P_I_O_N
// v 1.1
- 1