Dynamic Stop Loss Trail Strategy

Overview
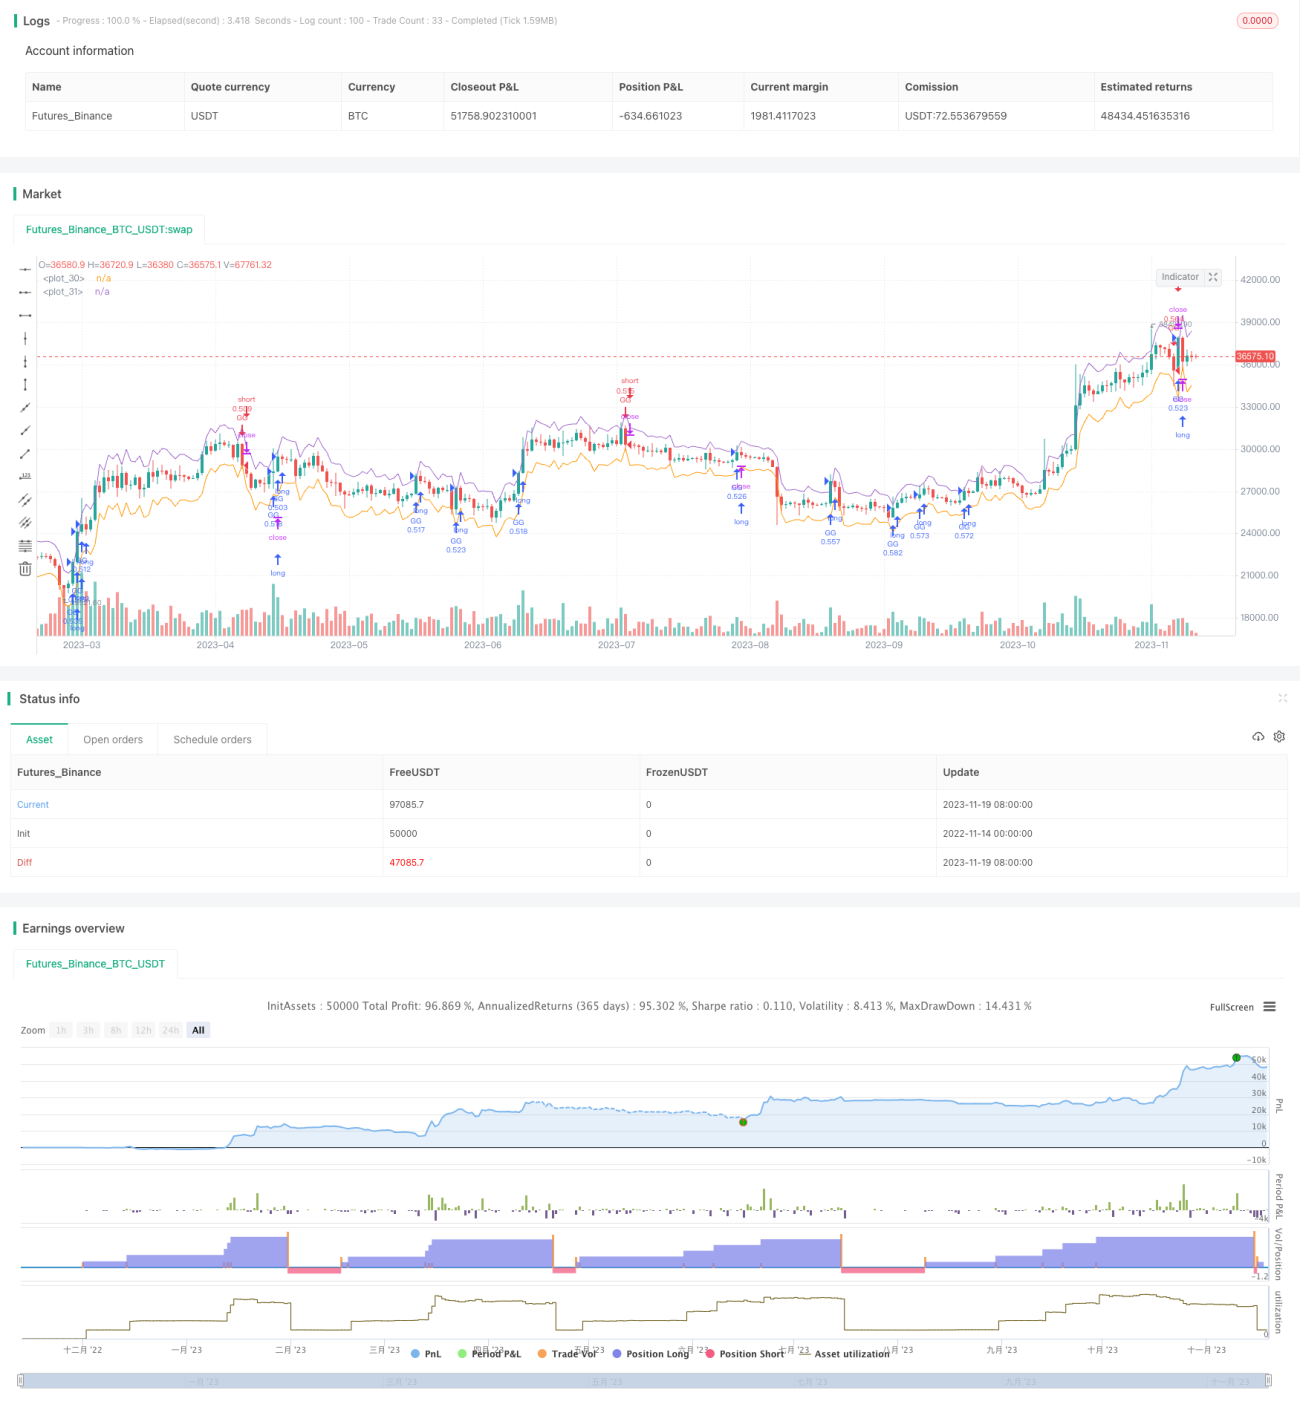
The dynamic stop loss trail strategy calculates the average true range (ATR) of stocks as a benchmark, combined with ATR coefficients set by users to dynamically set stop loss lines and trail lines to achieve the purpose of stop loss trail. When the stock price breaks through the trail line, a long position is established using a traditional trend tracking strategy; when the stock price falls below the stop loss line, a short position is established using a reversal strategy to make profits through two-way trading.
Strategy Principle
The strategy mainly uses the ATR technical indicator to calculate the average true range of stock prices, and combines ATR coefficients entered by users as benchmarks for stock breakout purchases and stop loss sells. Specifically, the strategy first calculates the ATR value of the stock over the past 120 days, then multiplies by the sell ATR coefficient set by the user to obtain the stop loss sell reference price, i.e. the stop loss line; multiplies by the buy ATR coefficient to obtain the buy reference price, i.e. the trail line. When today's highest price breaks through the trail line, a long position is established using a trend tracking strategy; when today's lowest price falls below the stop loss line and holds a long position, a short position is established using a reversal strategy.
The strategy also draws stop loss lines and trail lines. The positions of these two lines will change according to fluctuations in stock prices, with some dynamic tracking capabilities. The ATR indicator can better reflect the average true fluctuation range of a stock. Using the ATR indicator to set stop loss trail lines can help avoid losses caused by huge stock fluctuations to some extent.
Advantage Analysis
- Use ATR indicators to calculate stock price fluctuation range, stop loss trail line position is reasonable;
- Stop loss lines and trail lines change dynamically, with some trend tracking capability;
- Go long and short at the same time, two-way trading, more profit space;
- Suitable for highly volatile stocks, ATR indicators help control risks.
Risk Analysis
- ATR indicators react inadequately to emergencies, cannot completely avoid risks;
- Trailing buy-ins and stop loss sells are solely based on breaking ATR lines, there is some blind obedience, over-trading may occur;
- The rationality of user-entered ATR coefficients directly affects strategy efficacy, improper settings may cause losses;
- When stock fluctuation decreases, frequent stop loss trail may increase trading costs.
Optimization
- Combine other indicators to determine trading time, avoid blind tracking;
- Set position sizing rules and pyramiding rules to control risks;
- Add trading volume or volatility filters to avoid excessive trading;
- Dynamically adjust ATR parameters to optimize stop loss trail effect.
Summary
In summary, this is a typical stop loss trail strategy. The core idea is to set stop loss lines and trail lines based on ATR indicators for trend tracking. The advantages of this strategy are that two-way trading is enabled and positions are flexible; ATR indicators help control risks making it suitable for highly volatile stocks. However, there are some blind tracking risks due to rather simple trading rules; improper parameter settings also affect strategy efficacy. Future optimizations may focus on improving trade timing, controlling position sizes, reducing excess trading, etc. to make strategy performance more robust.
- 1