Dual Moving Average Crossover Arrow Strategy

Overview
This strategy identifies buying and selling signals by calculating the crossover of dual moving averages of the MACD indicator. It plots arrows on the chart to indicate trading signals.
Principles
The strategy first calculates the fast line (12-period EMA), slow line (26-period EMA) and MACD difference. It then determines long and short signals based on the crossover of the fast and slow lines, as well as the positive/negative value of the MACD difference:
- When the fast line crosses above the slow line (golden cross) and the MACD difference crosses above 0, it is a buy signal
- When the fast line crosses below the slow line (death cross) and the MACD difference crosses below 0, it is a sell signal
To filter out false signals, the code also checks the signal of the previous candlestick. The current signal is only triggered if the previous candlestick has an opposite signal (buy vs sell or vice versa).
In addition, arrow shapes are plotted on the chart to indicate buying and selling signals.
Advantages
The advantages of this strategy include:
- Using dual moving average crossover helps identify trends and filter out market noise
- Incorporating MACD difference avoids missing trades and false signals
- Arrows clearly indicate entries and exits
- Simple and easy-to-understand rules facilitate replication
Risks and Solutions
Some risks of this strategy:
- Crossovers may generate false signals and cause over-trading. Parameters can be adjusted or extra filters added to reduce fake signals.
- Unable to discern rangings in a trend, potentially leading to losses. Adding trend indicators like ADX can avoid this.
- Fixed rules cannot adapt to changing markets. Machine learning can potentially optimize this.
Enhancement Opportunities
Some ways to improve the strategy:
- Test different parameter combinations to find optimal settings for the fast line, slow line and MACD
- Add extra entry conditions like volume breakouts to filter signals
- Incorporate stop loss to control single trade loss
- Use volatility indicators like VIX to gauge risk appetite
- Try machine learning models instead of fixed rules to create adaptive optimization
Summary
The dual moving average crossover arrow strategy is fairly simple and practical. By using crossover of two moving averages and MACD difference filtering, it identifies entries and exits during intermediate and long term trends, avoiding missing price reversals. The arrow signals also provide clear operation guidance. Further improvements in stability and profitability can be achieved through parameter tuning, extra filters and adaptive optimization.
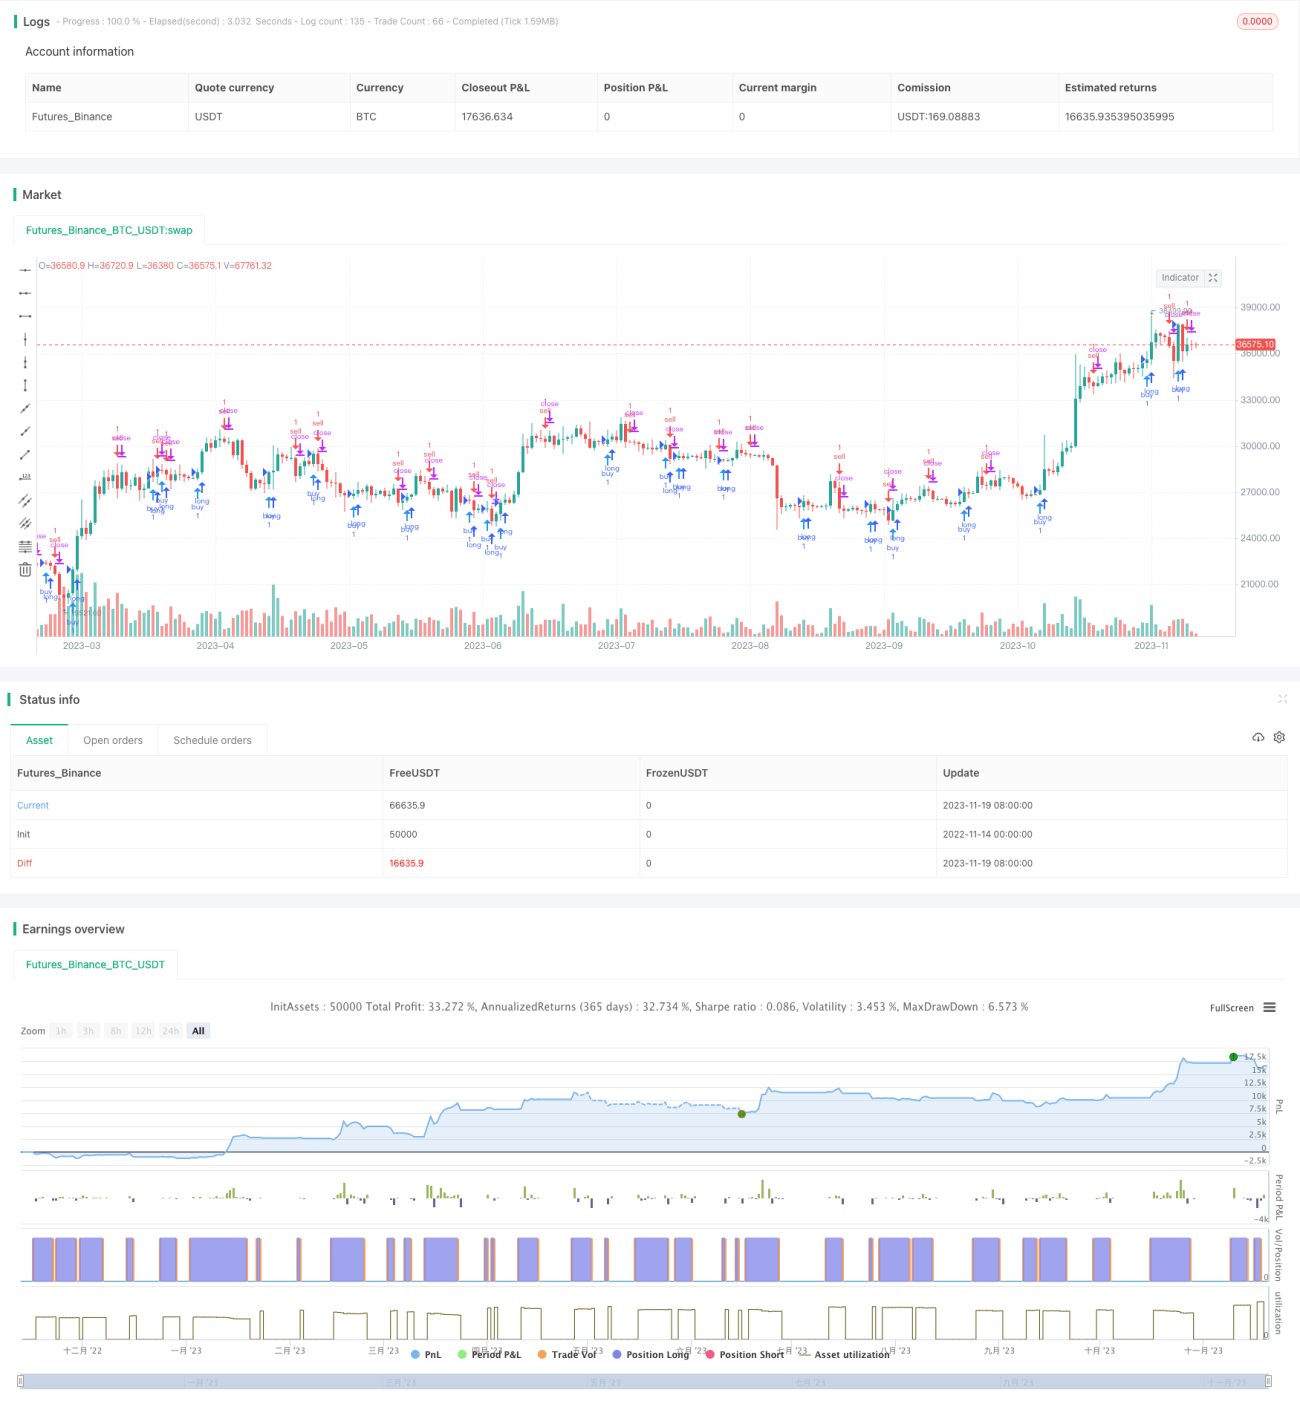
/*backtest
start: 2022-11-14 00:00:00
end: 2023-11-20 00:00:00
period: 1d
basePeriod: 1h
exchanges: [{"eid":"Futures_Binance","currency":"BTC_USDT"}]
*/

//@version=3
//Daniels stolen code
strategy(shorttitle="Daniels Stolen Code", title="Daniels Stolen Code", overlay=true, calc_on_order_fills=true, pyramiding=0)
- 1