Bollinger Bands Standard Deviation Breakout Strategy

1
Follow
1779
Followers
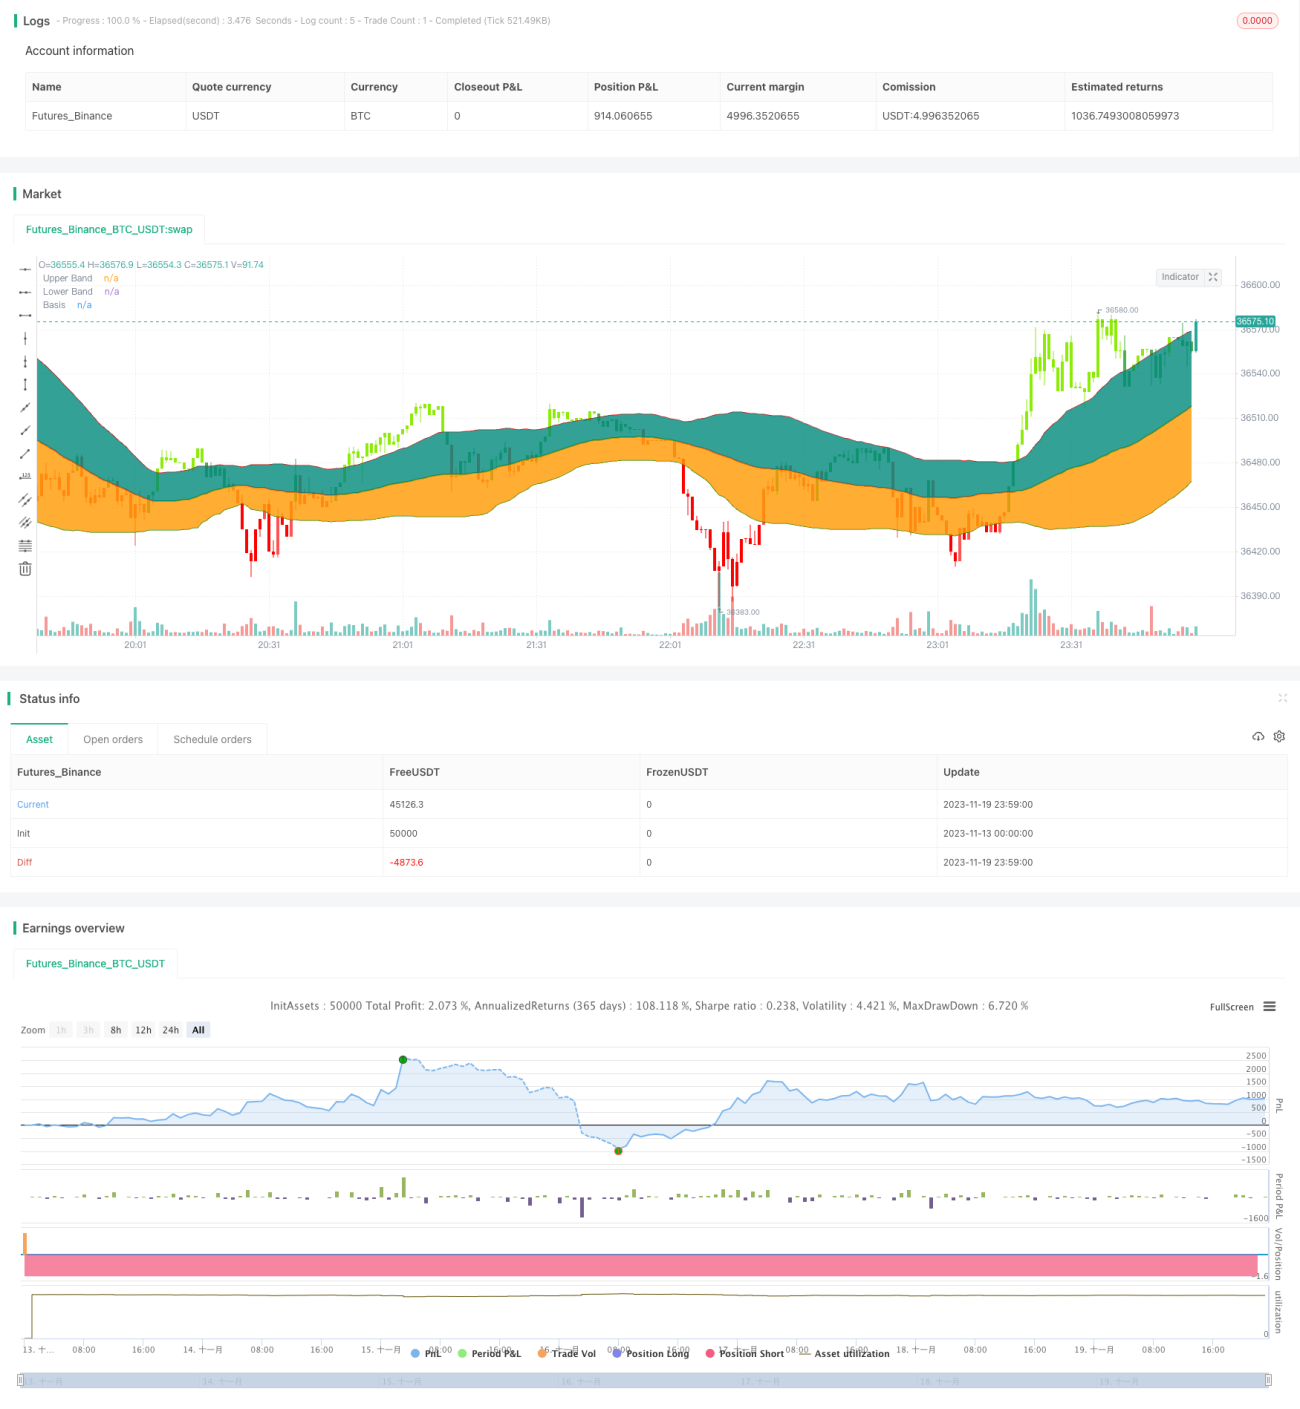
Overview
This strategy is based on the classic Bollinger Bands indicator. It goes long when the price closes above the upper band and goes short when the price closes below the lower band. It belongs to the trend following breakout strategy.
Strategy Logic
- The baseline is 55-day simple moving average.
- The upper and lower bands are one standard deviation above and below the baseline respectively.
- A long signal is generated when the price closes above the upper band.
- A short signal is generated when the price closes below the lower band.
- Using one standard deviation instead of the classic two standard deviations reduces the risk.
Advantage Analysis
- Using standard deviation instead of fixed value reduces risk.
- The 55-day moving average can better reflect the medium-term trend.
- Close breakout filters out false breakouts.
- Easy to determine trend direction through multi-timeframe analysis.
Risk Analysis
- Prone to churning small profits.
- Need to consider the impact of transaction fees.
- Breakout signals may be false breakouts.
- Slippage loss may occur.
Risks can be mitigated by setting stop loss, considering transaction fees, or adding indicator filters.
Optimization Directions
- Optimize baseline parameters to find the best moving average.
- Optimize the standard deviation size to find the optimal parameters.
- Add auxiliary volume indicators for judgement.
- Add stop loss mechanism.
Summary
The overall logic of this strategy is clear. It adjusts risk through the standard deviation band width and avoids false breakouts using close breakout. But it is still necessary to prevent oscillating losses by using stop loss, adding filters etc.
Source
Pine
Strategy parameters
Related strategies
Comment
All comments (0)
No data
- 1