Dynamic Moving Average Trend Crossover Strategy

Overview
The Dynamic Moving Average Trend Crossover Strategy is a trading system based on the Moving Average Convergence Divergence (MACD) indicator. This strategy relies on the difference between short-term and long-term moving averages to make buy or sell decisions, with the main idea being the monitoring of the relationship between short-term and long-term trends to predict potential market changes.
Strategy Principle
This strategy utilizes two different period Exponential Moving Averages (EMA): a fast EMA (8 days) and a slow EMA (16 days). The MACD value is derived from the difference between these two EMAs. Additionally, the strategy incorporates a signal line, which is the Simple Moving Average (SMA) of the MACD over 11 days. A buy signal is generated when the MACD line crosses above the signal line, indicating a bullish trend, and a sell signal when it crosses below, indicating a bearish trend.
At the code level, the strategy calculates the fast and slow EMAs, then derives the MACD value. Subsequently, the MACD’s SMA is calculated as the signal line. The position is determined by comparing the position of the MACD to the signal line. Moreover, the strategy offers a reverse trading option, allowing entry into the market on opposite signals.
Strategy Advantages
The main advantage of the Dynamic Moving Average Trend Crossover Strategy lies in its simplicity and sensitivity to changes in market trends. By using EMAs of different periods, this strategy effectively captures deviations between short-term and long-term trends, thus responding timely to market changes. The addition of the signal line further enhances the accuracy of the strategy, enabling investors to identify trend reversals more quickly.
Risk Analysis
While the Dynamic Moving Average Trend Crossover Strategy performs well in many situations, it also carries certain risks. The primary risk is the generation of misleading signals in highly volatile markets or during unclear trends. Additionally, reliance on historical data may lead to delayed responses. To mitigate these risks, investors can combine the strategy with other technical indicators or market analyses for decision-making.
Optimization Directions
Optimization of this strategy can include adjusting the lengths of the EMA periods, incorporating additional technical indicators, and considering market volatility factors. Adjusting the period lengths can make the strategy more adaptable to different market conditions. Introducing other indicators, such as
RSI or Bollinger Bands, can provide a more comprehensive view of the market. Considering market volatility factors, such as adjusting the strategy with ATR, can enhance the adaptability and robustness of the strategy.
Conclusion
The Dynamic Moving Average Trend Crossover Strategy is a quantitative trading strategy centered around the MACD. It aims to grasp market movements by analyzing the relationship between short-term and long-term trends. While this strategy is straightforward and effective, it is important to be aware of its limitations and potential risks. By continuously optimizing and integrating other analytical tools, investors can better utilize this strategy for effective market operations.
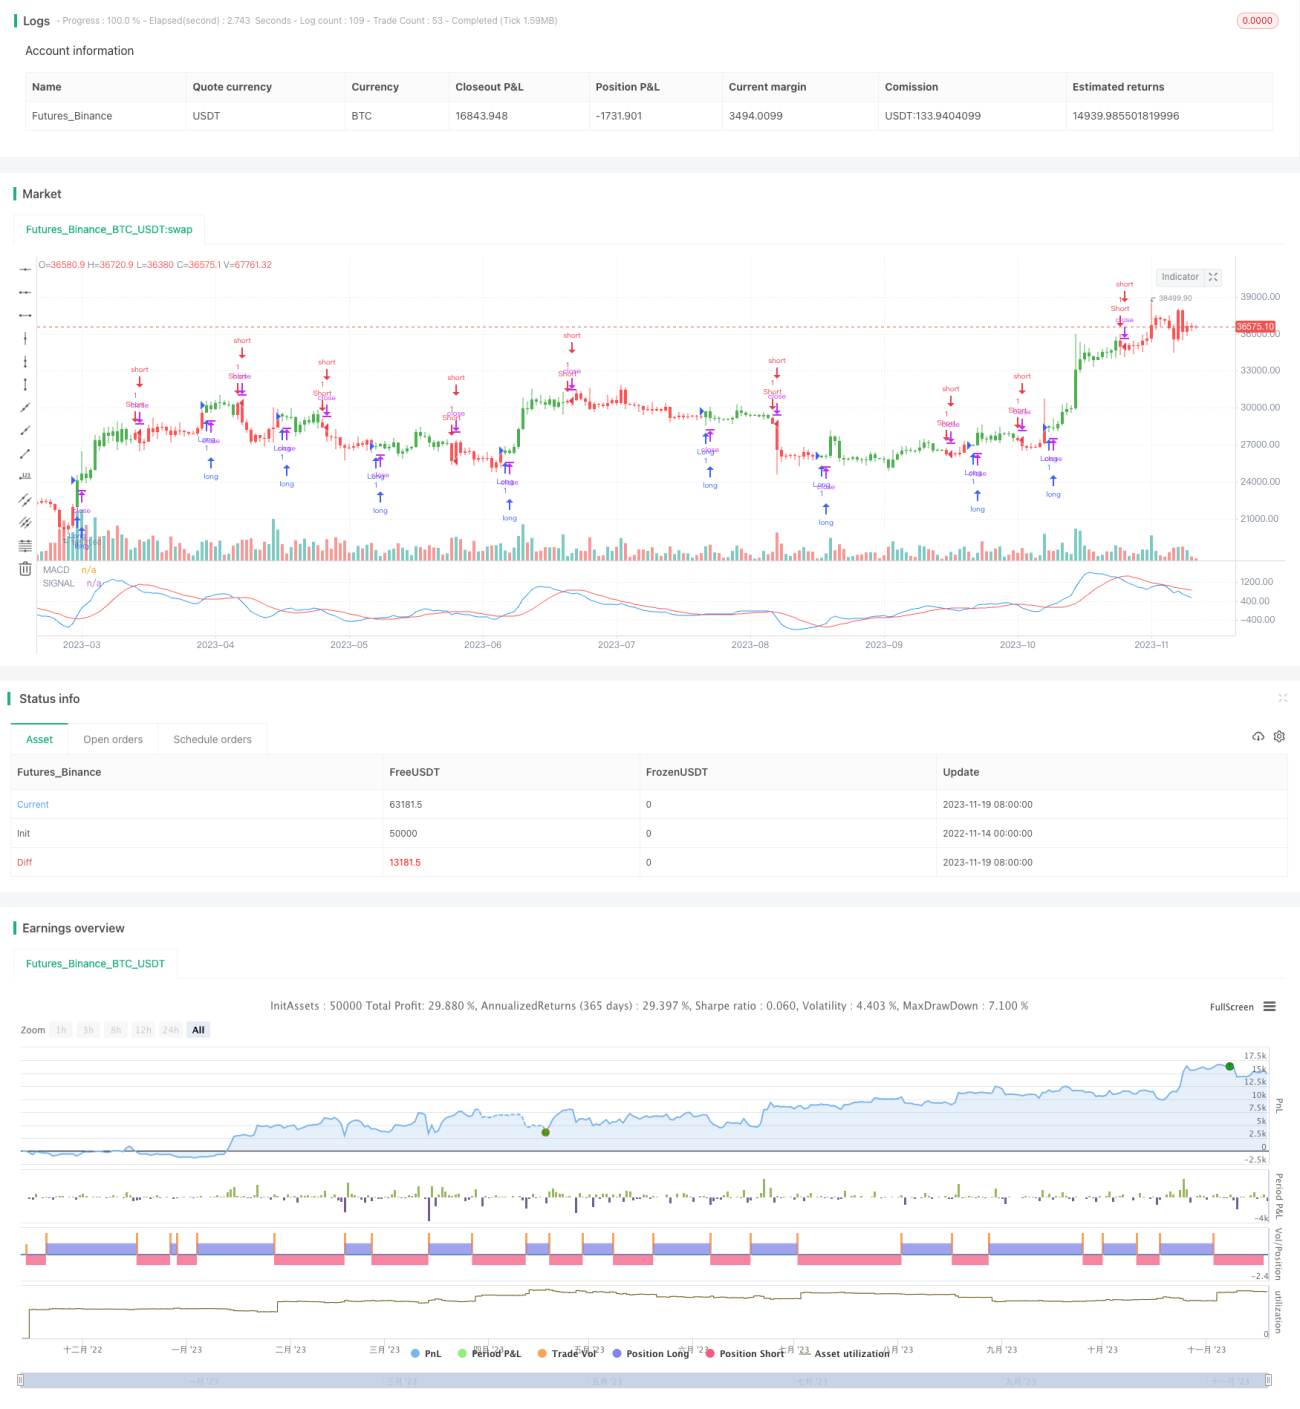
/*backtest
start: 2022-11-14 00:00:00
end: 2023-11-20 00:00:00
period: 1d
basePeriod: 1h
exchanges: [{"eid":"Futures_Binance","currency":"BTC_USDT"}]
*/

//@version=2
////////////////////////////////////////////////////////////
//  Copyright by HPotter v1.0 06/09/2017
// MACD – Moving Average Convergence Divergence. The MACD is calculated - 1