Heikin Ashi HighLow Channel Dynamic Moving Average Trading Strategy

Overview
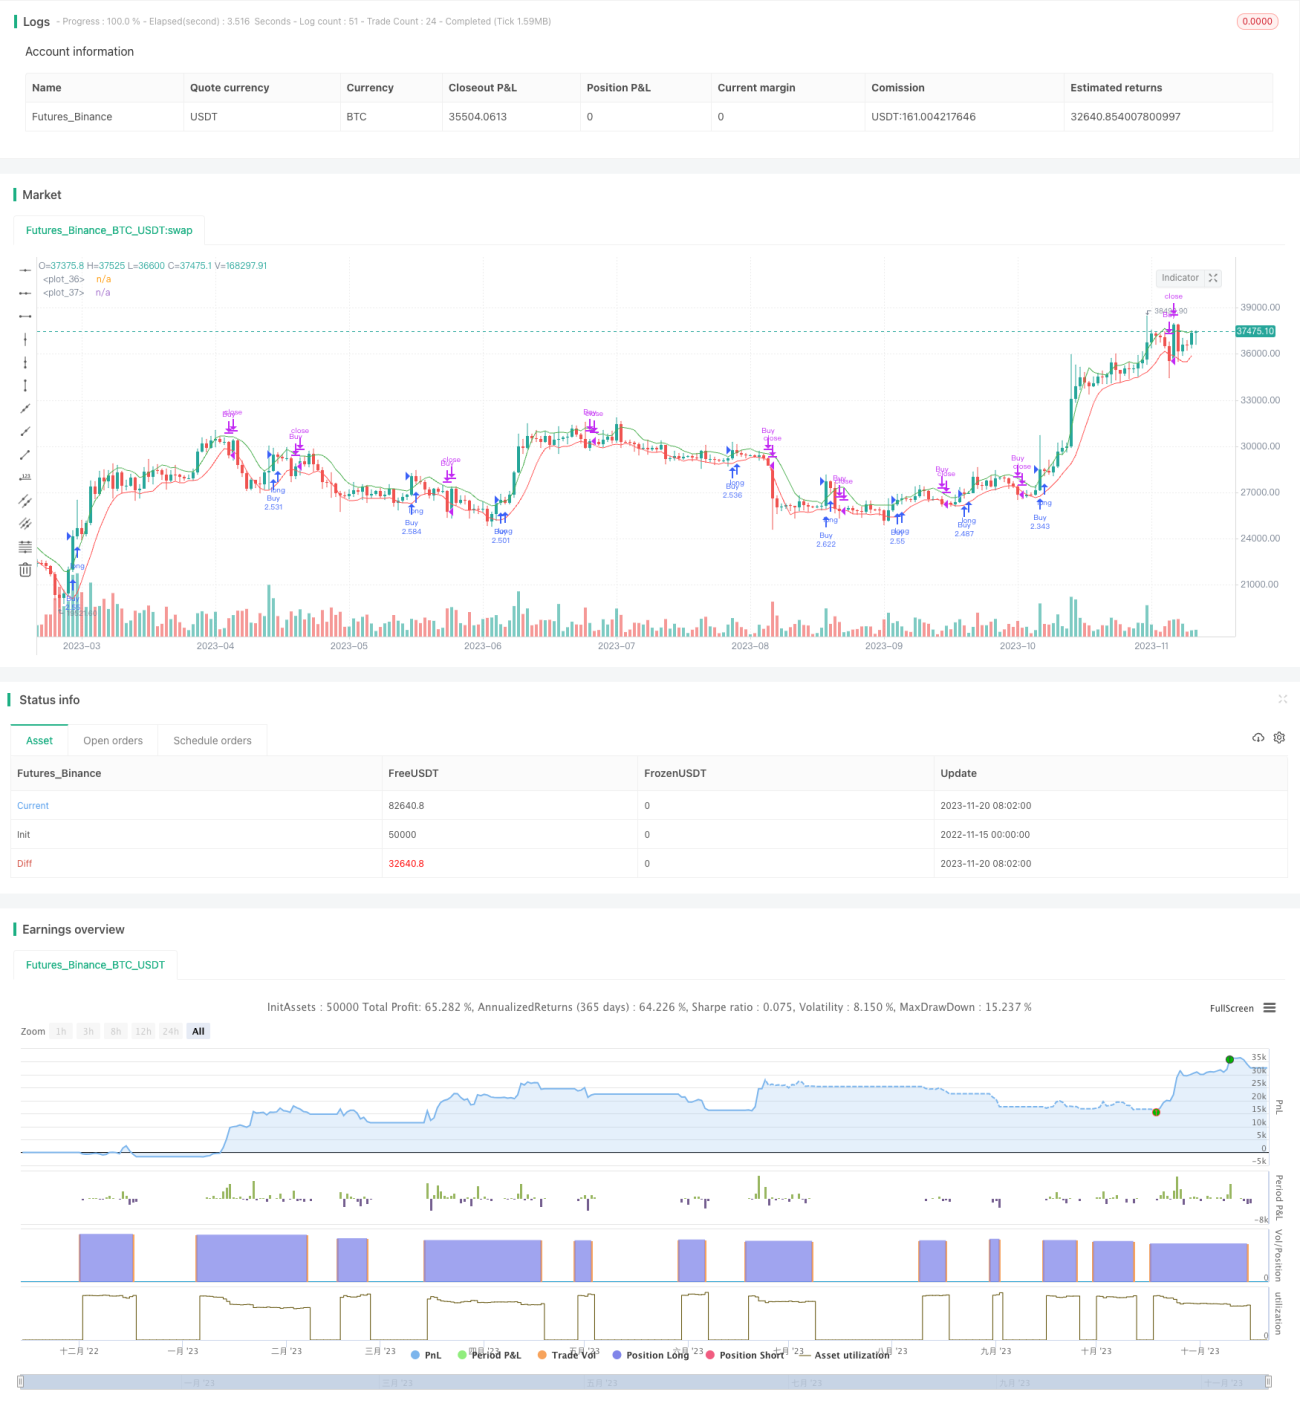
The Heikin Ashi HighLow Channel Dynamic Moving Average Trading Strategy is a strategy that generates trading signals by comparing the Heikin Ashi candlestick close price with dynamic moving averages. This strategy uses double moving averages to form a channel and enters long or exits long positions based on the candlestick close price breaking through the upper or lower rail of the channel.
Strategy Logic
This strategy utilizes the Heikin Ashi candlestick technical indicator. Heikin Ashi candlesticks can filter out market noise and identify trends. The strategy uses a lenh period moving average based on high prices to form the channel's upper rail and a lenl period moving average based on low prices to form the channel's lower rail. When the Heikin Ashi candlestick close price breaks through the upper rail, a buy signal is generated. When the Heikin Ashi candlestick close price breaks through the lower rail, a sell signal is generated.
Specifically, the strategy first calculates simple moving averages separately based on high and low prices to construct the channel. The moving average of high prices mah serves as the channel's upper rail, and the moving average of low prices mal serves as the channel's lower rail. Then it compares the Heikin Ashi candlestick close price to the upper and lower rails of the channel to generate trading signals. If the candlestick close price is higher than the upper rail mah, a long condition longCondition is generated. If the candlestick close price is lower than the lower rail mal, a short condition shortCondition is generated.
Advantages of the Strategy
- Using Heikin Ashi candlesticks can identify trends and filter out noise
- The double moving averages form a clear channel to judge support and resistance
- Dynamic moving averages adapt to market changes
- Simple and clear strategy logic
Risks of the Strategy
- Double moving averages can easily generate false signals
- Failures to break through are not considered
- Moving average lag may miss price reversal points
- No stop loss is set, which may lead to huge losses
To address the risks, stop loss mechanisms can be set, other indicators can be combined to confirm breakout signals, etc, to avoid unnecessary losses caused by false signals.
Directions for Optimization
- Evaluate the impact of different parameters and optimize
- Add indicators or models for signal filtering and confirmation
- Add risk control mechanisms like stop loss, trailing stop loss
- Backtest to evaluate performance metrics like return and risks
- Consider trading costs impact and adjust position sizing
Conclusion
The Heikin Ashi HighLow Channel Dynamic Moving Average Trading Strategy has clear, simple logic overall. It leverages the advantage of Heikin Ashi candlesticks to identify trends and uses double dynamic moving averages to determine support and resistance. The strategy can be further enhanced by optimizing parameters, adding signal filtering, implementing stop loss to reduce trading risks.
// This source code is subject to the terms of the Mozilla Public License 2.0 at https://mozilla.org/MPL/2.0/
// © shiner_trading
// [email protected]

//@version=4
strategy("Hi-Lo Channel Strategy", overlay=true, default_qty_type=strategy.percent_of_equity, initial_capital=500, default_qty_value=100, currency="USD")

lenh = input(5, "High-Based MA")
lenl = input (5, "Low-Based MA")
ha = input(true, "Use Heikin Ashi OHCL values (on real chart)?")
ha_h = security(heikinashi(syminfo.tickerid), timeframe.period, high)
ha_l = security(heikinashi(syminfo.tickerid), timeframe.period, low)- 1