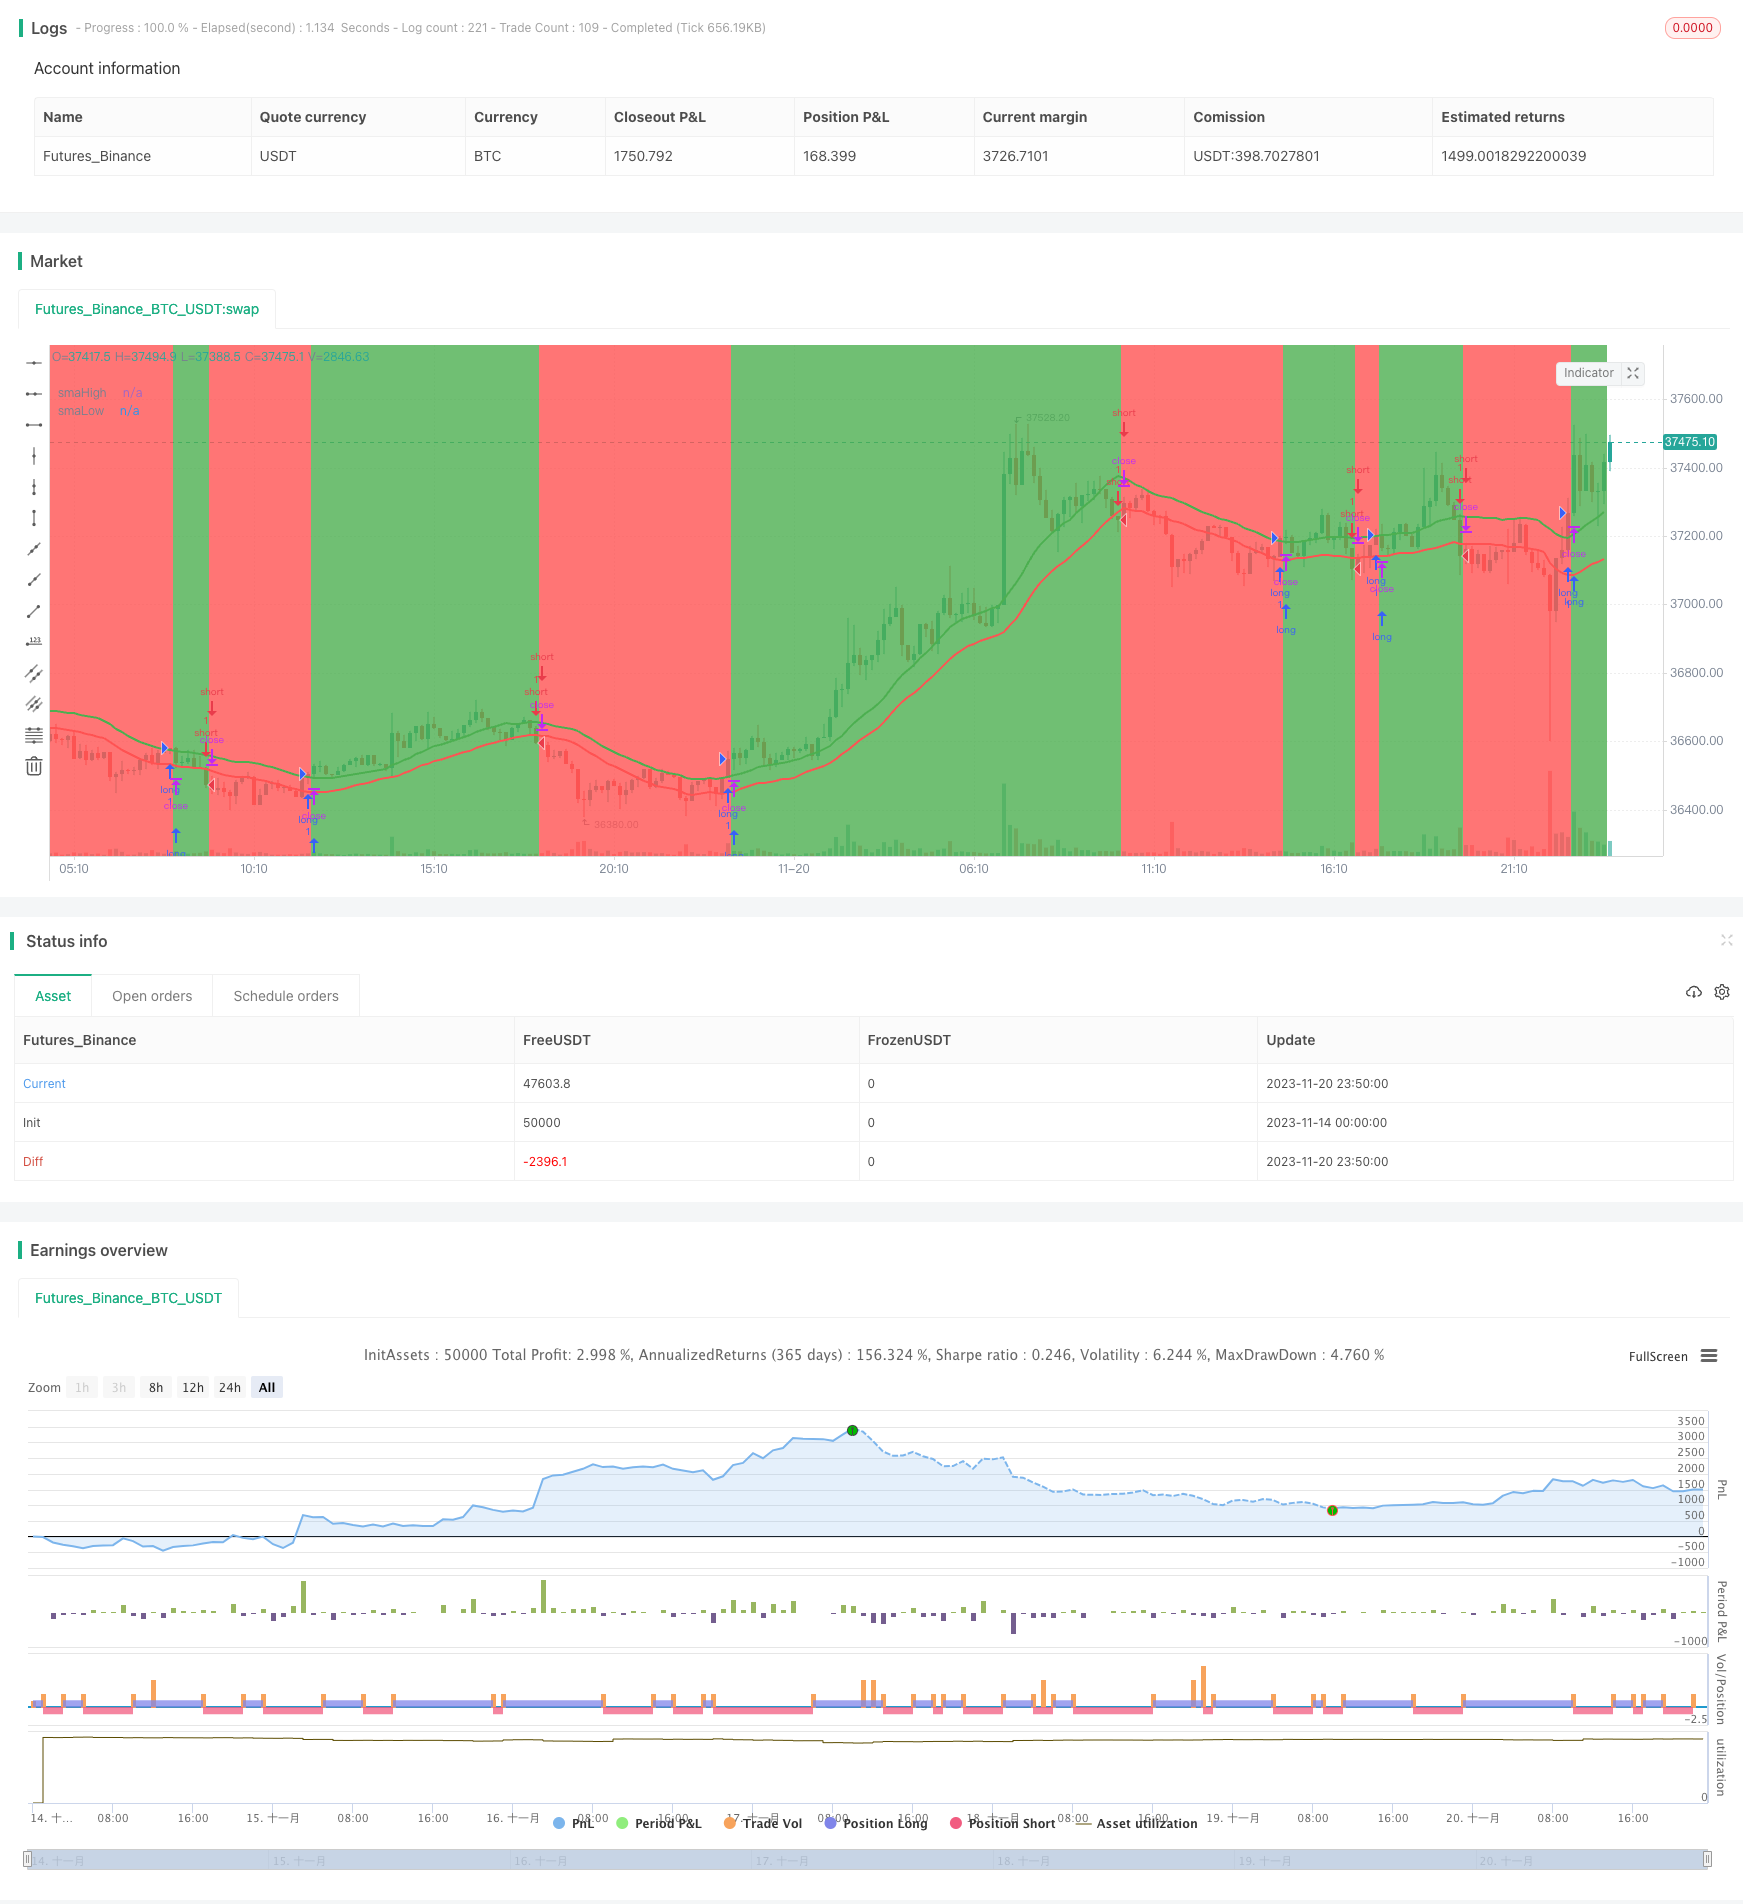
概述
本策略基于SMA指标构建了一个简单的多空策略。当价格上穿20周期高点SMA时做多,当价格下破20周期低点SMA时做空。同时设置了止损退出机制。
策略原理
本策略使用20周期的highest高价和lowest低价的SMA作为判断多空的指标。当价格上穿highest SMA时,认为目前处于上涨趋势,这时做多;当价格下破lowest SMA时,认为目前处于下跌趋势,这时做空。
具体来说,策略首先计算20周期highest高价和lowest低价的SMA,并画出指标线。然后设置如下交易逻辑:
多头入场:收盘价上穿highest SMA时 多头出场:收盘价下破0.99倍highest SMA时
空头入场:收盘价下破lowest SMA时
空头出场:收盘价上穿1.01倍lowest SMA时
这样,就构建了一个跟随趋势运行的多空策略。
优势分析
这种策略具有以下几个优势:
- 使用SMA指标判断趋势方向简单实用
2.HIGHEST SMA和LOWEST SMA作为支撑阻力线,发挥指标的重要作用
3.止损设计合理,最大程度避免巨额损失 4.适用性强,多种时间周期和品种都可使用
风险分析
该策略也存在一定的风险:
- SMA指标存在滞后,可能错过趋势转折点
- 无关市场突发事件的防范措施
- 没有考虑交易成本的影响
可以通过结合其他指标、设置止损、优化参数等方式来控制和降低这些风险。
优化方向
本策略还可以从以下几个方面进行优化:
- 结合其他指标判断趋势,例如MACD、KDJ等
- 添加对突发事件的防范机制,例如停牌、限价等异常情况的处理
- 优化SMA周期参数,寻找最佳参数组合
- 考虑不同品种、不同时间周期的最佳参数
- 评估交易成本的影响,设定最佳的止损位和止盈位
总结
本策略整体思路清晰、易于实现,通过SMA指标判断多空趋势,设置合理的入场退出机制,可以获得不错的效果。有进一步优化的空间,若配合其他指标和技巧,可以成为一个值得长期跟踪的having良好潜力的策略。
策略源码
/*backtest
start: 2023-11-14 00:00:00
end: 2023-11-21 00:00:00
period: 10m
basePeriod: 1m
exchanges: [{"eid":"Futures_Binance","currency":"BTC_USDT"}]
*/

// This source code is subject to the terms of the Mozilla Public License 2.0 at https://mozilla.org/MPL/2.0/
// © AlanAntony

//@version=4


strategy("ma 20 high-low",overlay=true)

//compute the indicators

smaH = sma(high, 20)
smaL = sma(low, 20)


//plot the indicators
plot(smaH,title="smaHigh", color=color.green, linewidth=2)


plot(smaL,title="smaLow", color=color.red, linewidth=2)


//trading logic
enterlong = crossover(close,smaH) //positive ema crossover
exitlong = crossunder(close,0.99*smaH)  //exiting long


entershort = crossunder(close,smaL) //negative EMA Crossover
exitshort = crossover(close,1.01*smaH) //exiting shorts


notintrade = strategy.position_size<=0
bgcolor(notintrade ? color.red:color.green)

//execution logic

start = timestamp(2015,6,1,0,0)
//end = timestamp(2022,6,1,0,0)

if time >= start
    strategy.entry( "long", strategy.long,1, when = enterlong)
    strategy.entry( "short", strategy.short,1, when = entershort)

    strategy.close("long", when = exitlong)
    strategy.close("short", when = exitshort)

//if time >= end
   // strategy.close_all()