概述
这是一个基于均线指标的简单量化交易策略。它利用快慢均线的金叉死叉来判断买入和卖出时机。当快线从下方向上突破慢线时,产生买入信号;当快线从上方向下突破慢线时,产生卖出信号。
策略原理
该策略主要基于均线的趋势跟踪功能。快线参数小,能快速响应价格变化;慢线参数大,代表长期趋势。快线从下方穿过慢线意味着短期行情开始反转,进入上涨趋势;而快线从上方穿过慢线意味着短期行情开始反转,进入下跌趋势。通过捕捉这些信号,可以顺势进行交易。
具体来说,该策略中定义了5日(快线)和34日(慢线)的双均线。每日计算这两个均线的值,并比较快线是否从下方向上突破慢线。如果发生金叉信号,则做多;如果发生死叉信号,则平仓。
优势分析
这种策略简单易懂,容易实现。相比其他复杂策略,它更适合量化交易的初学者。
双均线策略可以有效过滤市场噪音,捕捉主要趋势。通过调整快慢均线的日数参数,可以适应不同周期的行情变化。
该策略还内置了止损机制。当价格开始反向,快慢均线发生死叉时,它会及时止损,可以有效控制风险。
风险分析
双均线策略可能出现止损不住、曲线拟合失败等风险。具体来说,主要存在以下问题:
均线有滞后性,可能出现完全调头之后才发出信号的情况。这时已获利变成亏损。
震荡行情中,可能出现多次虚假信号。这时将造成过多不必要的交易,增加交易成本和滑点损失。
该策略完全依赖技术指标,没有结合基本面分析。遇到重大消息驱动的行情时,效果可能会很差。
未考虑位置管理和风险控制。一个意外事件可能让策略爆仓。
优化方向
为更好发挥该策略优势、减少风险,可以从以下几个方面进行优化:
结合趋势指标和波动指标,设定更严格的入场条件,过滤假信号。例如 MACD 或 KDJ 指标。
加入适当的止损机制。如在金叉后下跌一定比例就止损。或在形成新高(低)点后下跌一定幅度就止损。
优化快慢均线的日数参数组合,针对不同周期价格变化进行调整。可以做参数组合优化寻找最佳参数。
可以根据大盘指数来判断整体行情走势,避免在震荡行情高频交易。
结合交易量变化来验证趋势信号的可靠性。例如增加必须有放量突破的条件。
总结
双均线策略是一个非常典型的量化交易策略。它有着简单、直观、容易实现等特点,十分适合量化交易初学者来学习和掌握。通过不断测试和优化参数,能获得较好的效果。但该策略也存在一些问题,如滞后识别信号、容易产生假信号等。这需要加入辅助条件进行过滤,并做好风险管理,使之成为一个稳定盈利的策略。
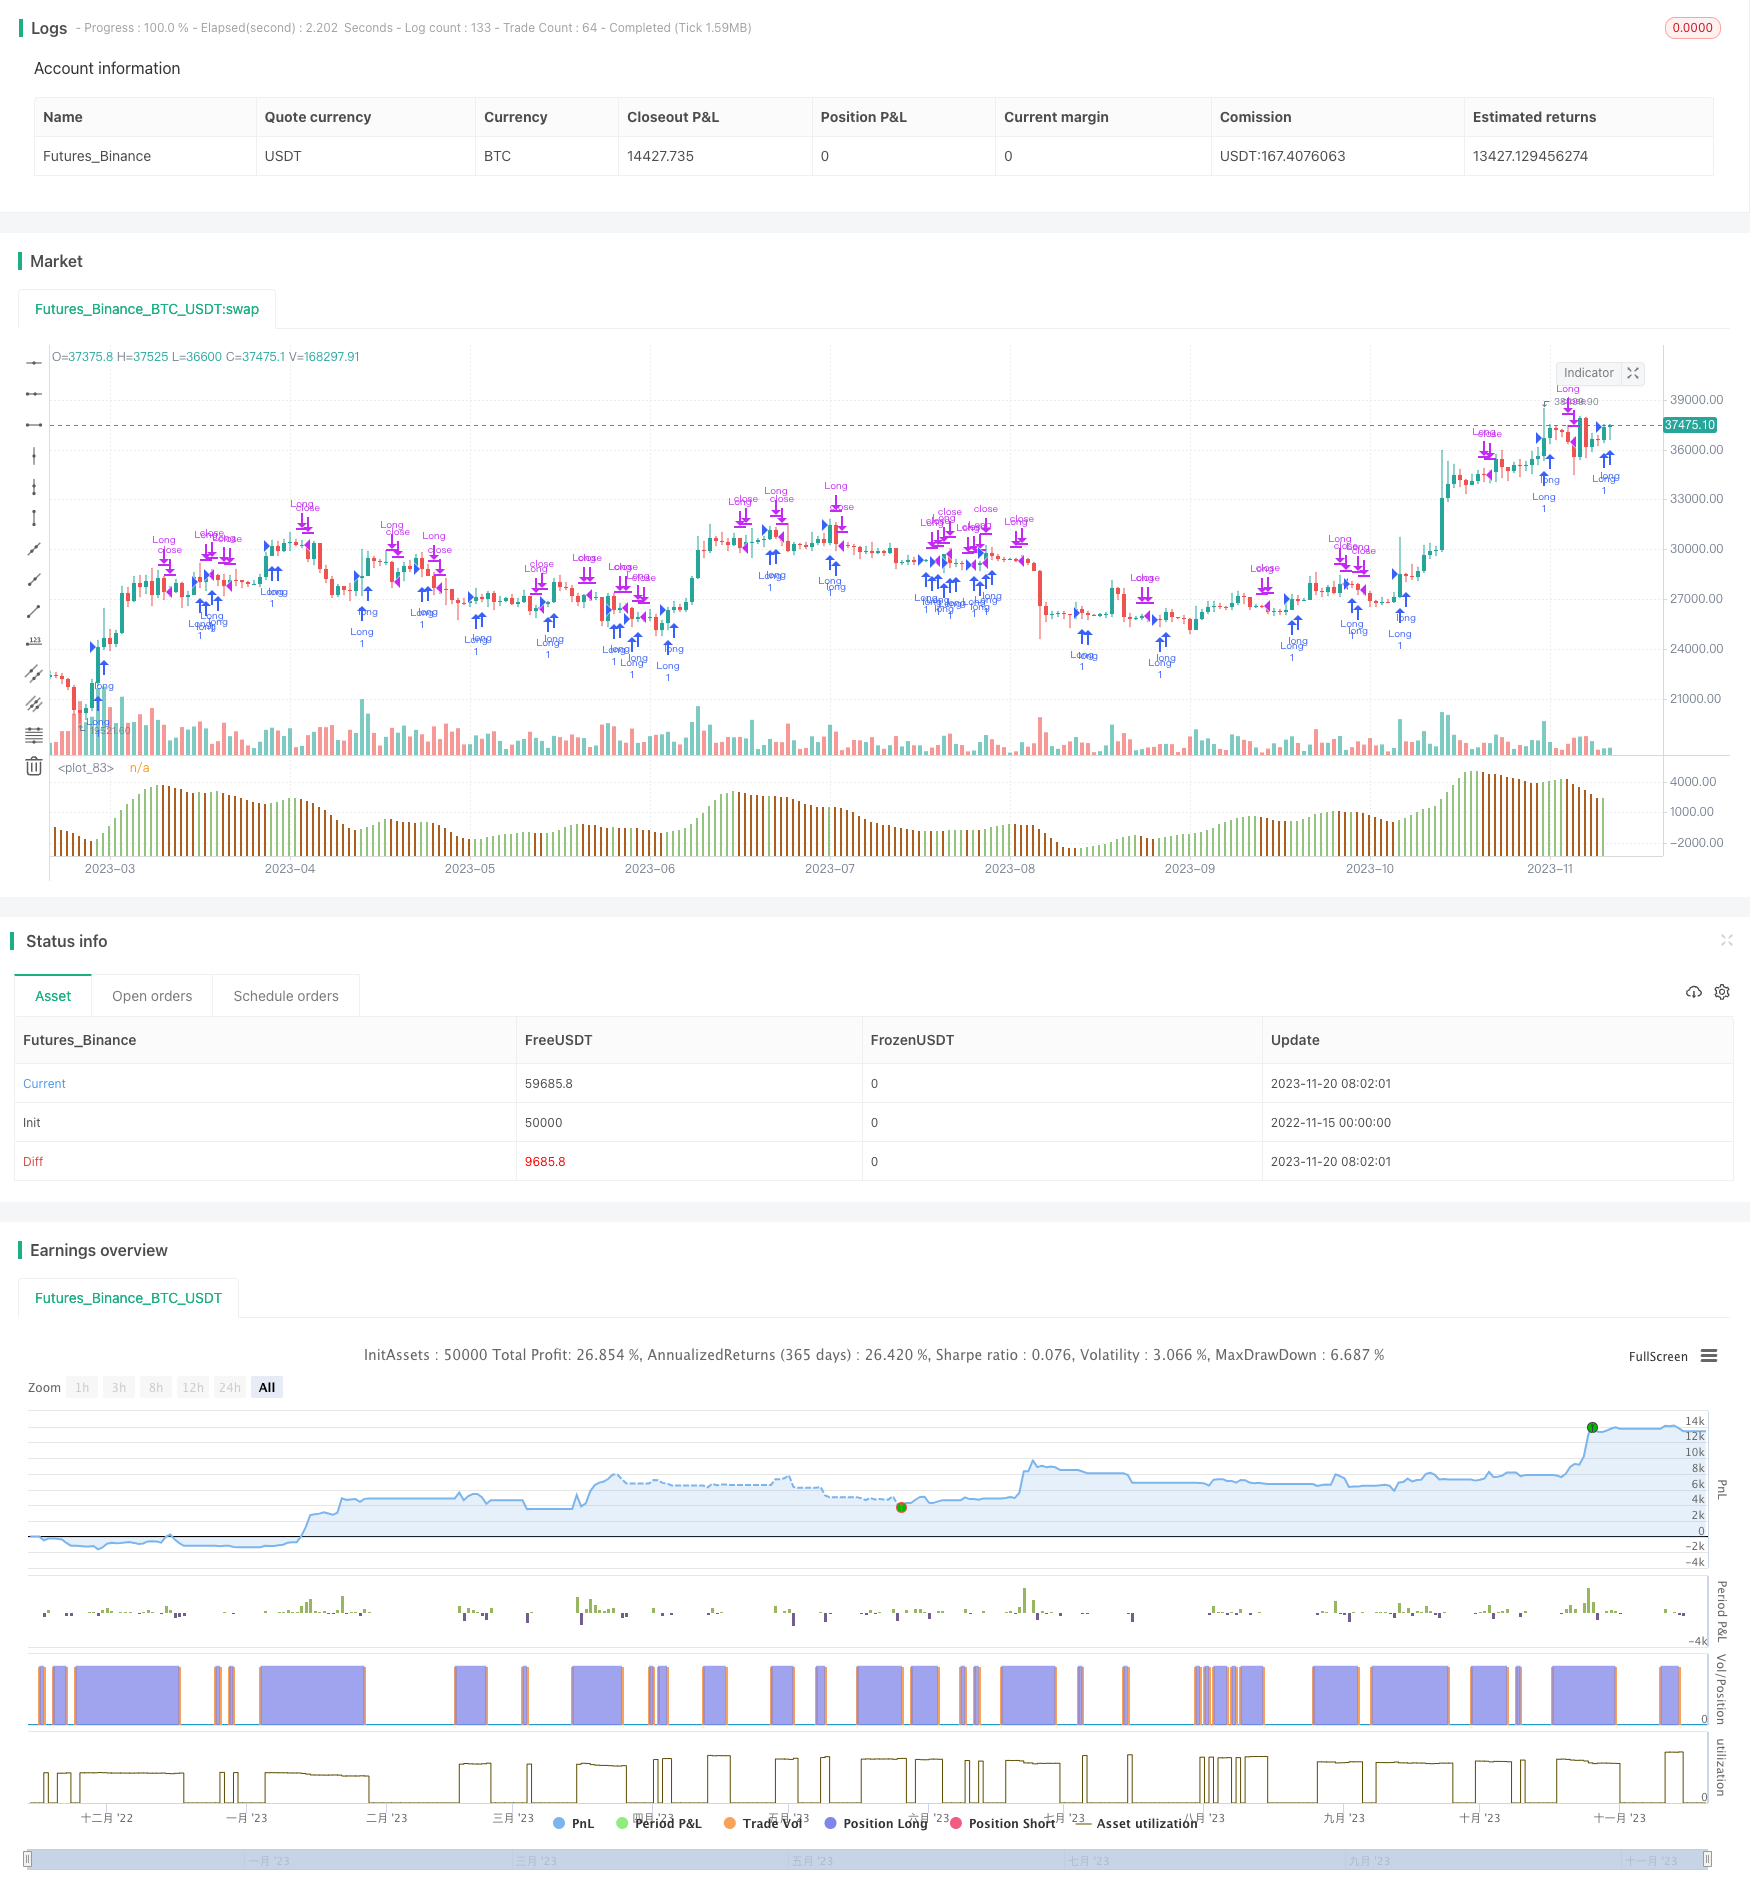
/*backtest
start: 2022-11-15 00:00:00
end: 2023-11-21 00:00:00
period: 1d
basePeriod: 1h
exchanges: [{"eid":"Futures_Binance","currency":"BTC_USDT"}]
*/

//@version=2
////////////////////////////////////////////////////////////
// This strategy is a modification to the "Bill Williams, Awesome Oscillator
// (AO) Backtest" strategy (Copyright by HPotter v1.0 29/12/2016)
//
// This version of the strategy by Midnight Mouse. 10/4/2018
//
// DESCRIPTION
//
// This indicator plots the oscillator as a column where periods fit for buying
// are marked as green, and periods fit for selling as orange/brown. If the
// current value of AO (Awesome Oscillator) is > the previous, the period is
// deemed fit for buying and the indicator is marked green. If the AO values is
// not over the previous, the period is deemed fit for selling and the indicator
// is marked orange/brown.
//
// You can change long to short in the Input Settings
//
// Please, use it only for learning or paper trading. Do not for real trading.
////////////////////////////////////////////////////////////

strategy("Awesome Oscillator.MMouse_Lager_BCE")

// === SETTINGS ===

// Strategy start date
FromMonth   = input(defval = 1,    title = "From Month", minval = 1)
FromDay     = input(defval = 1,    title = "From Day",   minval = 1)
FromYear    = input(defval = 2017, title = "From Year",  minval = 2014)

// Strategy settings
nLengthSlow = input(34, minval=1,  title="Length Slow")
nLengthFast = input(5,  minval=1,  title="Length Fast")
allowShorts = input(false,         title="Include Short Trades")
reverse     = input(false,         title="Trade reverse")


// === BODY ===

// Use Heikin-Ashi candles for the buy/sell signal
ha_t        = heikinashi(syminfo.tickerid)
ha_high     = security(ha_t, timeframe.period, high)
ha_low      = security(ha_t, timeframe.period, low)
length      = input( 14 )
price       = open
vrsi        = rsi(price, length)

// Calc (H+L)/2 for each length
xSMA1_hl2   = sma((ha_high + ha_low)/2, nLengthFast)
xSMA2_hl2   = sma((ha_high + ha_low)/2, nLengthSlow)

// Get SMA difference (Fast - Slow)
xSMA1_SMA2  = xSMA1_hl2 - xSMA2_hl2

// Derive the color of the column
cClr = xSMA1_SMA2 > xSMA1_SMA2[1] ? #93c47d : #ad5e1d

// Determine the position to take (Long vs. Short)
pos = iff(xSMA1_SMA2 > xSMA1_SMA2[1],  1, iff(xSMA1_SMA2 < xSMA1_SMA2[1], -1, nz(pos[1], 0)))
possig = iff(reverse and pos == 1, -1, iff(reverse and pos == -1, 1, pos))

// Only apply strategy from the start date
if (time >= timestamp(FromYear, FromMonth, FromDay, 00, 00))
    if (possig == 1)
        // Market is currently fit for a Long position
        strategy.entry("Long", strategy.long)

    if (possig == -1)
        // Market is currently fit for a Short position
        if(allowShorts)
            // Shorts are allowed. Record a Short position
            strategy.entry("Short", strategy.short)
        else
            // Shorts are not allowed. Closec the Long position.
            strategy.close("Long")

// Define the candle colors
//barcolor(possig == -1 ? red :
//         possig ==  1 ? green :
//         blue )

// Plot the oscillator
plot(xSMA1_SMA2, style=columns, linewidth=1, color=cClr)