Trend Following Strategy Based on Stochastic and CCI

Author: ChaoZhang, Date: 2023-11-22 16:23:31
Tags:

img

Overview

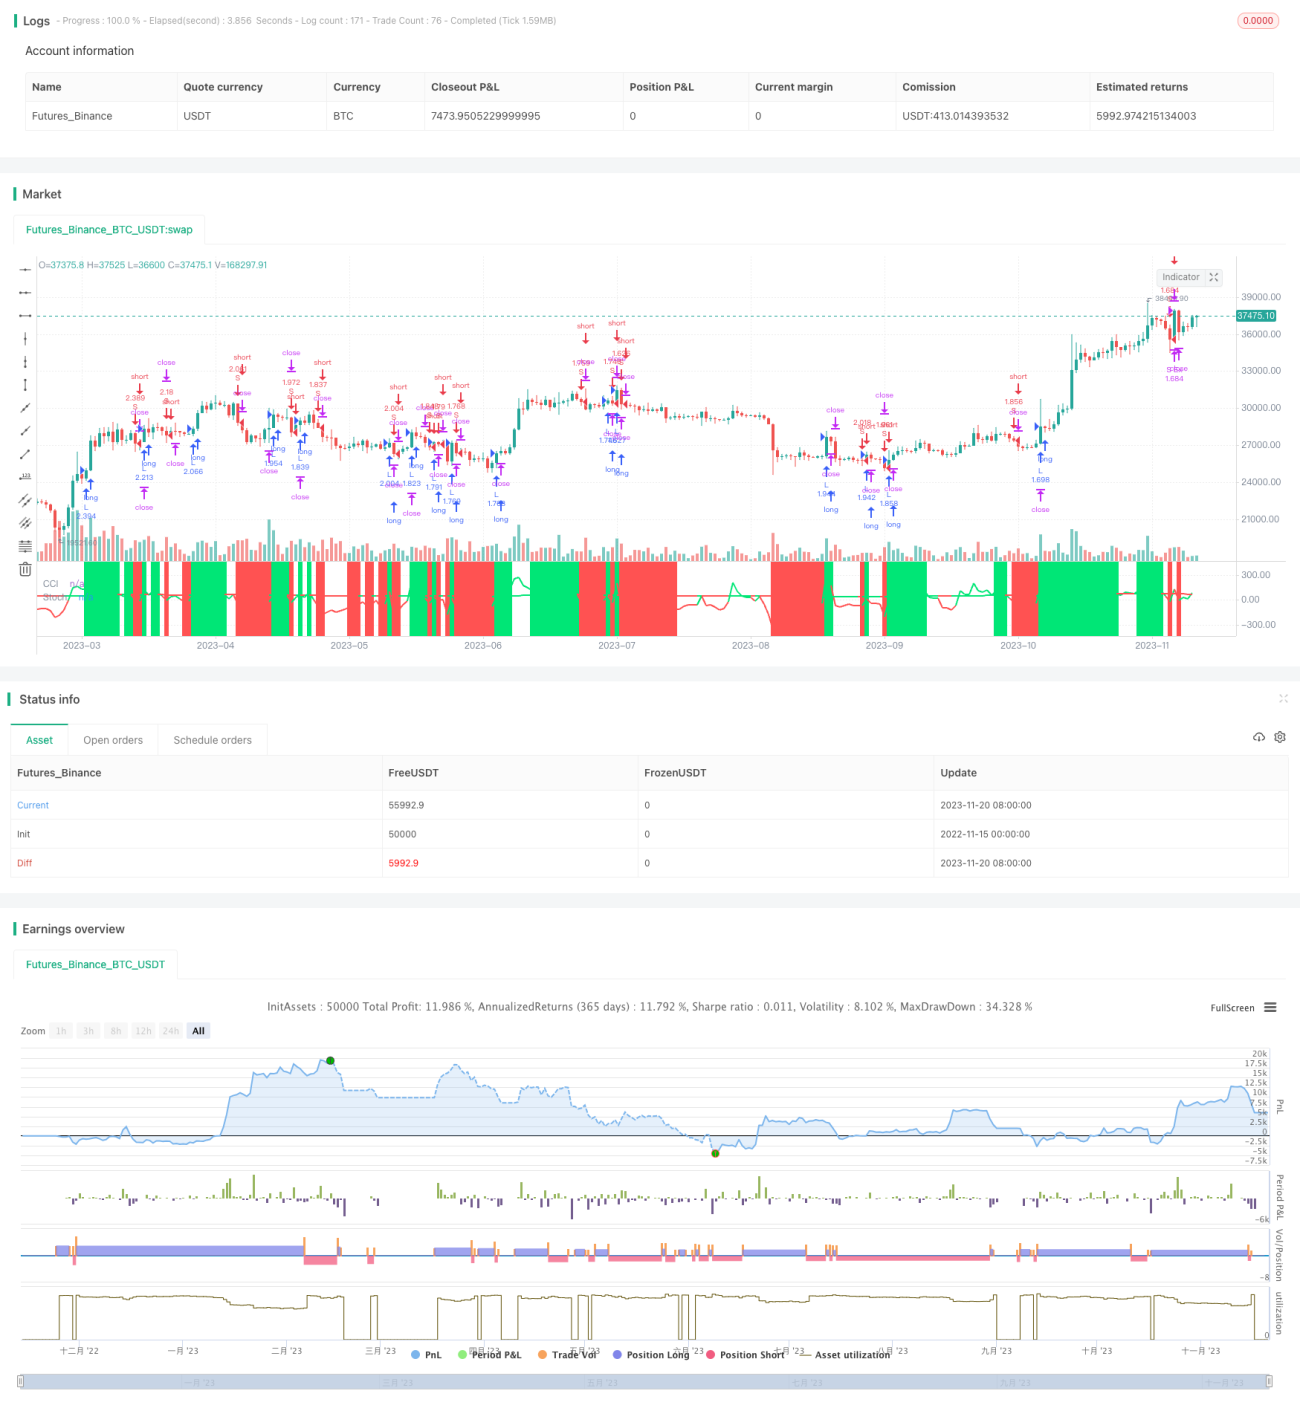
This strategy combines Stochastic indicator and CCI indicator to identify trend direction, and uses Rate of Change indicator to filter out range-bound trends, in order to follow the trend. The strategy adopts breakout entry and stop loss exit.

Strategy Logic

  1. Stochastic indicator judges bullish/bearish pattern
    Golden cross of Stochastic is buy signal, while death cross is sell signal
  2. CCI indicator determines trend direction CCI above 0 indicates bullish market, while below 0 bearish market
  3. Rate of Change indicator filters range-bound trend
    Set parameters of Rate of Change to judge whether price is in an active trend
  4. Entry and exit rules Long entry: Stochastic golden cross & CCI > 0 & active trend Short entry: Stochastic death cross & CCI < 0 & active trend Stop loss exit: 3% stop loss for both long and short side

Pros Analysis

  1. Combination of Stochastic and CCI improves accuracy of trend judgment
  2. Rate of Change filters out range-bound trends, avoiding invalid trades
  3. Both long and short trading, able to catch different trend types
  4. Breakout entry timely catches trend opportunity
  5. Strict stop loss prevents huge loss and controls risk

Risks Analysis

  1. Improper parameter setting may lead to over-conservative or aggressive strategy
  2. Limited effect of indicators, may fail in extreme market conditions
  3. Breakout entry misses early stage of trends, giving up part of profit
  4. Too tight or too wide stop loss fails in risk control

Optimization Directions

  1. Parameter optimization to find optimum combination
  2. Add more trend indicators to improve effectiveness
  3. Use trailing stop loss or time-based stop loss to reduce chance of stop loss breach
  4. Add risk metrics like max drawdown to fully control risk

Summary

This strategy judges trend direction by integrating Stochastic, CCI and Rate of Change indicators, and catches trend opportunity with breakout tracking. Its pros lie in accurate judgment empowered by indicator combination, filtering of range-bound market, and strict stop loss for risk control. The next step is to further improve the strategy via parameter optimization, multiple indicators, stop loss strategy to make it more robust and flexible.


/*backtest
start: 2022-11-15 00:00:00
end: 2023-11-21 00:00:00
period: 1d
basePeriod: 1h
exchanges: [{"eid":"Futures_Binance","currency":"BTC_USDT"}]
*/

//@version=4
strategy("Stochastic CCI BF 🚀", overlay=false, initial_capital=10000, default_qty_type=strategy.percent_of_equity, default_qty_value=100, commission_type=strategy.commission.percent, commission_value=0.075)

/////////////// Time Frame ///////////////
testStartYear = input(2017, "Backtest Start Year") 
testStartMonth = input(1, "Backtest Start Month")
testStartDay = input(1, "Backtest Start Day")
testPeriodStart = timestamp(testStartYear,testStartMonth,testStartDay, 0, 0)

testStopYear = input(2019, "Backtest Stop Year")
testStopMonth = input(12, "Backtest Stop Month")
testStopDay = input(31, "Backtest Stop Day")
testPeriodStop = timestamp(testStopYear,testStopMonth,testStopDay, 0, 0)

testPeriod() => true

///////////// CCI ///////////// 
src = close
ccilength = input(13, minval=1, title="CCI Length")
c=cci(src, ccilength)

///////////// Stochastic ///////////// 
len = input(19, minval=1, title="RSI Length")
lenema = input(12, minval=1, title="RSI-EMA Length")
up = rma(max(change(src), 0), len)
down = rma(-min(change(src), 0), len)
rsi = down == 0 ? 100 : up == 0 ? 0 : 100 - (100 / (1 + up / down))
out = ema(rsi, lenema)

///////////// Rate Of Change ///////////// 
source = close
roclength = input(30, minval=1)
pcntChange = input(7.0, minval=1)
roc = 100 * (source - source[roclength]) / source[roclength]
emaroc = ema(roc, roclength / 2)
isMoving() => emaroc > (pcntChange / 2) or emaroc < (0 - (pcntChange / 2))

/////////////// Strategy ///////////////
long = out > out[1] and isMoving() and c > 0
short = out < out[1] and isMoving() and c < 0

last_long = 0.0
last_short = 0.0
last_long := long ? time : nz(last_long[1])
last_short := short ? time : nz(last_short[1])

long_signal = crossover(last_long, last_short)
short_signal = crossover(last_short, last_long)

last_open_long_signal = 0.0
last_open_short_signal = 0.0
last_open_long_signal := long_signal ? open : nz(last_open_long_signal[1])
last_open_short_signal := short_signal ? open : nz(last_open_short_signal[1])

last_long_signal = 0.0
last_short_signal = 0.0
last_long_signal := long_signal ? time : nz(last_long_signal[1])
last_short_signal := short_signal ? time : nz(last_short_signal[1])

in_long_signal = last_long_signal > last_short_signal
in_short_signal = last_short_signal > last_long_signal

last_high = 0.0
last_low = 0.0
last_high := not in_long_signal ? na : in_long_signal and (na(last_high[1]) or high > nz(last_high[1])) ? high : nz(last_high[1])
last_low := not in_short_signal ? na : in_short_signal and (na(last_low[1]) or low < nz(last_low[1])) ? low : nz(last_low[1])

sl_inp = input(3.0, title='Stop Loss %') / 100 

since_longEntry = barssince(last_open_long_signal != last_open_long_signal[1]) 
since_shortEntry = barssince(last_open_short_signal != last_open_short_signal[1]) 

slLong = in_long_signal ? strategy.position_avg_price * (1 - sl_inp) : na
slShort = strategy.position_avg_price * (1 + sl_inp)
long_sl = in_long_signal ? slLong : na
short_sl = in_short_signal ? slShort : na

/////////////// Execution ///////////////
if testPeriod()
    strategy.entry("L",  strategy.long, when=long_signal)
    strategy.entry("S", strategy.short, when=short_signal)
    strategy.exit("L Ex", "L", stop=long_sl, when=since_longEntry > 0)
    strategy.exit("S Ex", "S", stop=short_sl, when=since_shortEntry > 0)

/////////////// Plotting /////////////// 
bgcolor(long_signal ? color.lime : short_signal ? color.red : na, transp=30)
bgcolor(not isMoving() ? color.white : long ? color.lime : short ? color.red : na, transp=80)
plot(out, color = out > out[1] ? color.lime:color.red, linewidth = 2, title="Stoch")
plot(c, color = c > 0 ? color.lime:color.red, linewidth = 2, title="CCI")

More