Moving Average Crossover Strategy

Overview
The moving average crossover strategy is a simple yet effective quantitative trading strategy based on moving averages. It uses the crossover of a fast moving average line and a slow moving average line to generate buy and sell signals. When the fast line breaks through the slow line from below, a buy signal is generated. When the fast line breaks down through the slow line from above, a sell signal is generated.
Strategy Logic
The core logic of this strategy lies in using moving averages to judge market trends. Moving averages themselves have the functionality of filtering out random market noise. The fast moving average can respond to price changes faster and reflect the latest trends, while the slow moving average responds slower to the latest price changes and represents medium to long term trends. The breakthrough of the fast line through the slow line means that the short-term trend has reversed to be consistent with the medium-long term trend, thus generating trading signals.
Specifically, this strategy first defines the fast moving average sig1 and the slow moving average sig2. Then, buy and sell points are determined according to the crossover relationships between sig1 and sig2. When sig1 breaks through sig2 from below, a long condition longCondition is generated. When sig1 breaks down through sig2 from above, a short condition shortCondition is generated. The strategy then places orders when long and short conditions are met, and sets stop loss and take profit to exit orders.
Advantage Analysis
The advantages of this strategy are significant:
- Simple logic, easy to understand and implement
- Flexible parameter tuning, can be optimized under different market conditions
- Can be combined with other indicators to filter signals and improve stability
- Good performance, for example the EMA15-EMA30 combo can achieve 83% win rate on the EURCHF daily data
Risk Analysis
There are also some risks with this strategy:
- Severe whipsaw effects, stop loss configuration is crucial
- Poor performance in ranging, sideways markets
- Requires extensive testing and parameter tuning to fit different products and timeframes
Optimization measures:
- Add other indicators for judgement to avoid whipsaws
- Adjust MA types and parameters to suit different products
- Optimize stop loss and take profit ratios to control risks
Conclusion
In general, the moving average crossover strategy is a quant strategy with simple logic, strong practicality and stability. With parameter tuning and proper optimizations, it can generate steady profits in various market environments. Worth focusing on and applying for quantitative traders.
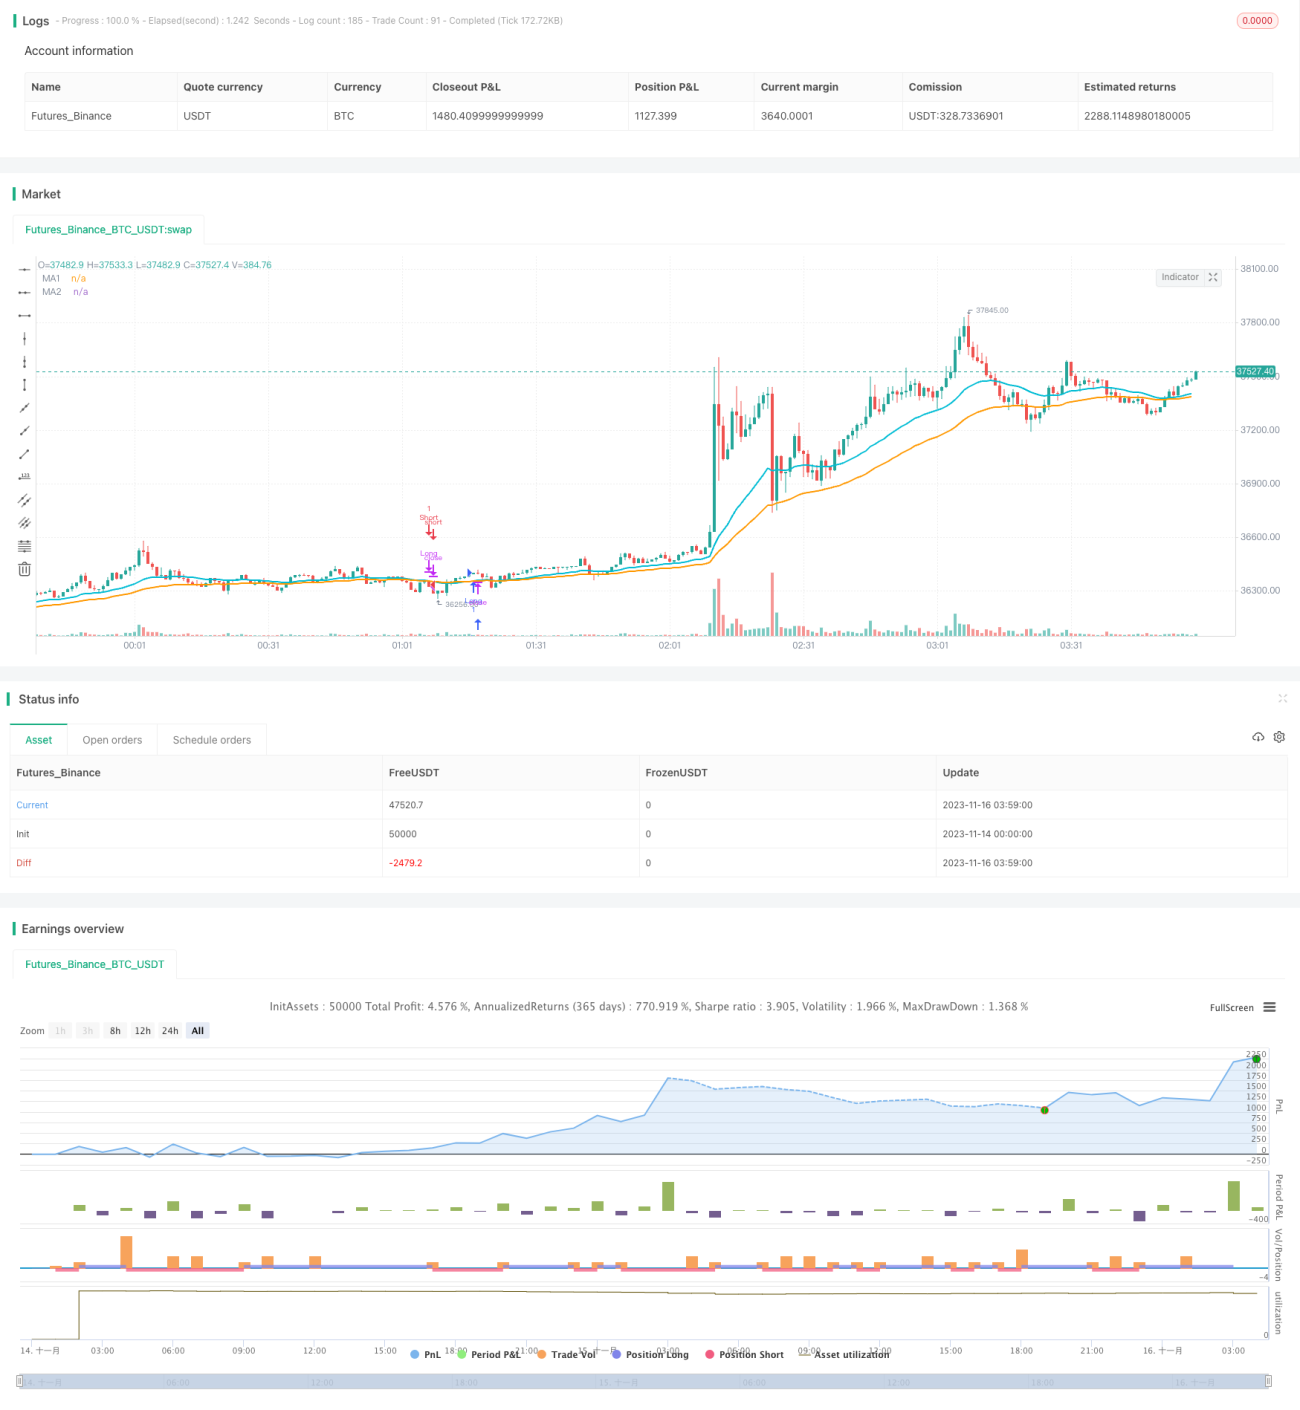
/*backtest
start: 2023-11-14 00:00:00
end: 2023-11-16 04:00:00
period: 1m
basePeriod: 1m
exchanges: [{"eid":"Futures_Binance","currency":"BTC_USDT"}]
*/

//@version=3
// Simple yet effective MA cross strategy.
// You'll have to tune the parameters to get an optimal win ratio.
// If JPY or XAU or any other currency with pips defined as the - 1