Modern Laguerre Transform Relative Strength Index Optimization Strategy

Overview
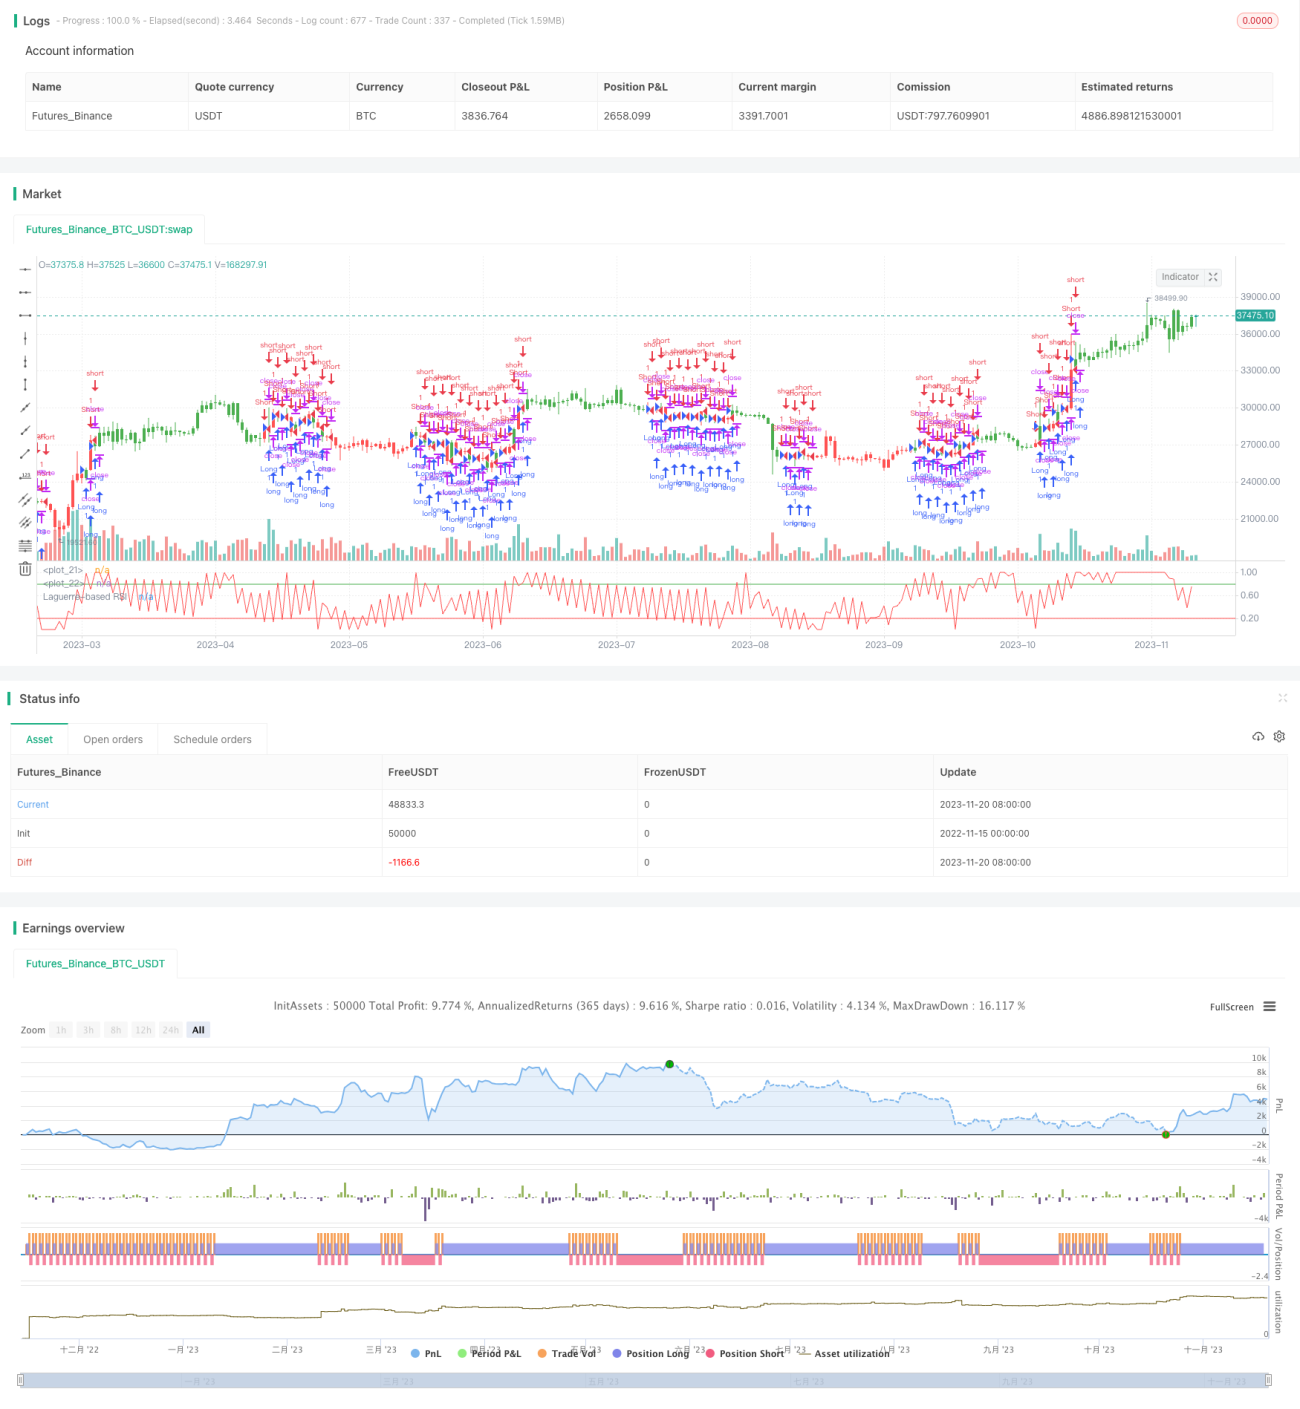
This article delves into the optimized strategy of the Relative Strength Index (RSI) based on the Laguerre Transform. Utilizing the advanced mathematical tool - the Laguerre Transform - this strategy enhances the sensitivity of the RSI indicator, allowing it to respond more rapidly to market price movements.
Strategy Principle
The Laguerre Transform RSI indicator, through the use of the Laguerre filter, creates effective indicators even over short data lengths. The crux of the strategy lies in processing the price series with the Laguerre Transform, resulting in four levels of Laguerre lines (xL0, xL1, xL2, xL3). These lines are calculated based on a given gamma parameter, which is used to analyze market trends.
The strategy employs CU (cumulative up) and CD (cumulative down) values to ascertain market strength. The calculation of CU and CD is based on the relative positions of the Laguerre lines. This method enables the RSI value to reflect price changes more promptly, thus providing traders with timely trading signals.
Trading signals are generated by comparing the RSI value with user-defined buy and sell thresholds (BuyBand and SellBand). The strategy suggests going long when the RSI is above the buy threshold and short when it is below the sell threshold.
Advantages Analysis
- Rapid Response: The use of the Laguerre Transform enables the strategy to respond quickly to market changes over short data lengths.
- Flexibility: The strategy allows users to adjust
gamma, buy, and sell thresholds according to their preferences. - Strong Adaptability: It adapts well to different market conditions and is sensitive to short- and medium-term price movements.
Risk Analysis
- Market Volatility: In highly volatile markets, the indicator might produce misleading signals.
- Parameter Selection: Incorrect parameter settings can lead to inaccurate trading signals.
- Overtrading: Due to the high sensitivity of the indicator, it might lead to frequent trading and high transaction costs.
Optimization Direction
- Parameter Optimization: Conduct extensive historical data testing to find the optimal
gammavalue and buying/selling thresholds. - Combining with Other Indicators: Use in conjunction with other technical analysis tools to reduce misleading signals.
- Enhanced Adaptability: Develop mechanisms for dynamic adjustment of parameters to adapt to different market conditions.
Conclusion
Overall, the RSI optimization strategy based
on the Laguerre Transform is an innovative and efficient trading tool. Its main advantages lie in its rapid response to market changes and the high customizability of its parameters. However, like any trading strategy, it also has its risks, especially in highly volatile market environments. To maximize the effectiveness of this strategy, traders should combine it with other technical analysis tools and make careful parameter adjustments. In summary, this strategy provides a valuable tool for traders seeking short-term and medium-term market opportunities.
/*backtest
start: 2022-11-15 00:00:00
end: 2023-11-21 00:00:00
period: 1d
basePeriod: 1h
exchanges: [{"eid":"Futures_Binance","currency":"BTC_USDT"}]
*/

//@version=2
////////////////////////////////////////////////////////////
//  Copyright by HPotter v1.0 01/09/2017
// This is RSI indicator which is more sesitive to price changes. - 1