概述
本策略名称为“基于波动带反转的 Bollinger 量化策略”。该策略利用 Bollinger 带的上下轨进行买卖判断。当股价处于波动带下轨附近,并且有向下突破的迹象时,表明股价可能处于反转的时机,这时进行买入;当股价上涨到波动带上轨附近时,表明股价可能反转下跌,这时进行卖出。
策略原理
该策略使用 RSI 指标判断买入时机。具体来说,它会判断最近一个 bar 的收盘价是否低于前 6 个 bar 的最低价, meantime 布林带宽度(BBW)大于设置阈值,并且布林带比率(BBR)位于设置的区间。如果满足这些条件,则表明股价可能处于反转的时机,这时进行买入开仓。
Exit 则比较简单,当 RSI 大于 70 时,表明股价过热,这时进行卖出平仓。
优势分析
该策略最大的优势在于,利用 Bollinger 带的上下轨进行判断,布林带反转时,进行买入和卖出,可以抓住短期的反转机会。与简单的 RSI 策略相比,本策略在判断买入时机更加严谨,可以避免错误交易的概率。
另外,该策略对参数较为敏感,可以通过调整 BBW、BBR 的参数,针对不同的品种进行优化,从而获得更好的效果。
风险分析
该策略的主要风险在于,布林带并不能百分之百预测价格反转,如果判断时机不当,则很容易形成错过最佳买入时机或者虚拟损失的情况。
此外,股价的短期波动可能会导致策略频繁开仓和平仓,增加交易成本和滑点成本。如果反转的力度不够,则会面临亏损平仓的风险。
优化方向
该策略可以从以下几个方面进行优化:
优化参数。可以用更精细的方法对 BBW、BBR 等参数进行测试和优化,针对不同的交易品种选择最优参数。
增加止损机制。可以设置移动止损或者时间止损,以控制最大亏损。
结合其他指标。可以和 KDJ、MACD 等其他指标结合,使买入信号更加准确可靠。
优化退出机制。目前的退出机制较简单,可以优化,例如设定适当的移动止盈,或者结合波动情况进行退出。
总结
本策略利用 Bollinger 带的特性,判断价格可能反转的时机,进行买入和卖出。相比单一的 RSI 等指标,本策略判断时机更加准确。通过参数优化和止损、止盈的设置,可以使策略更加可靠。但布林带预测并不完美,因此策略实现的效果还有一定的随机性。
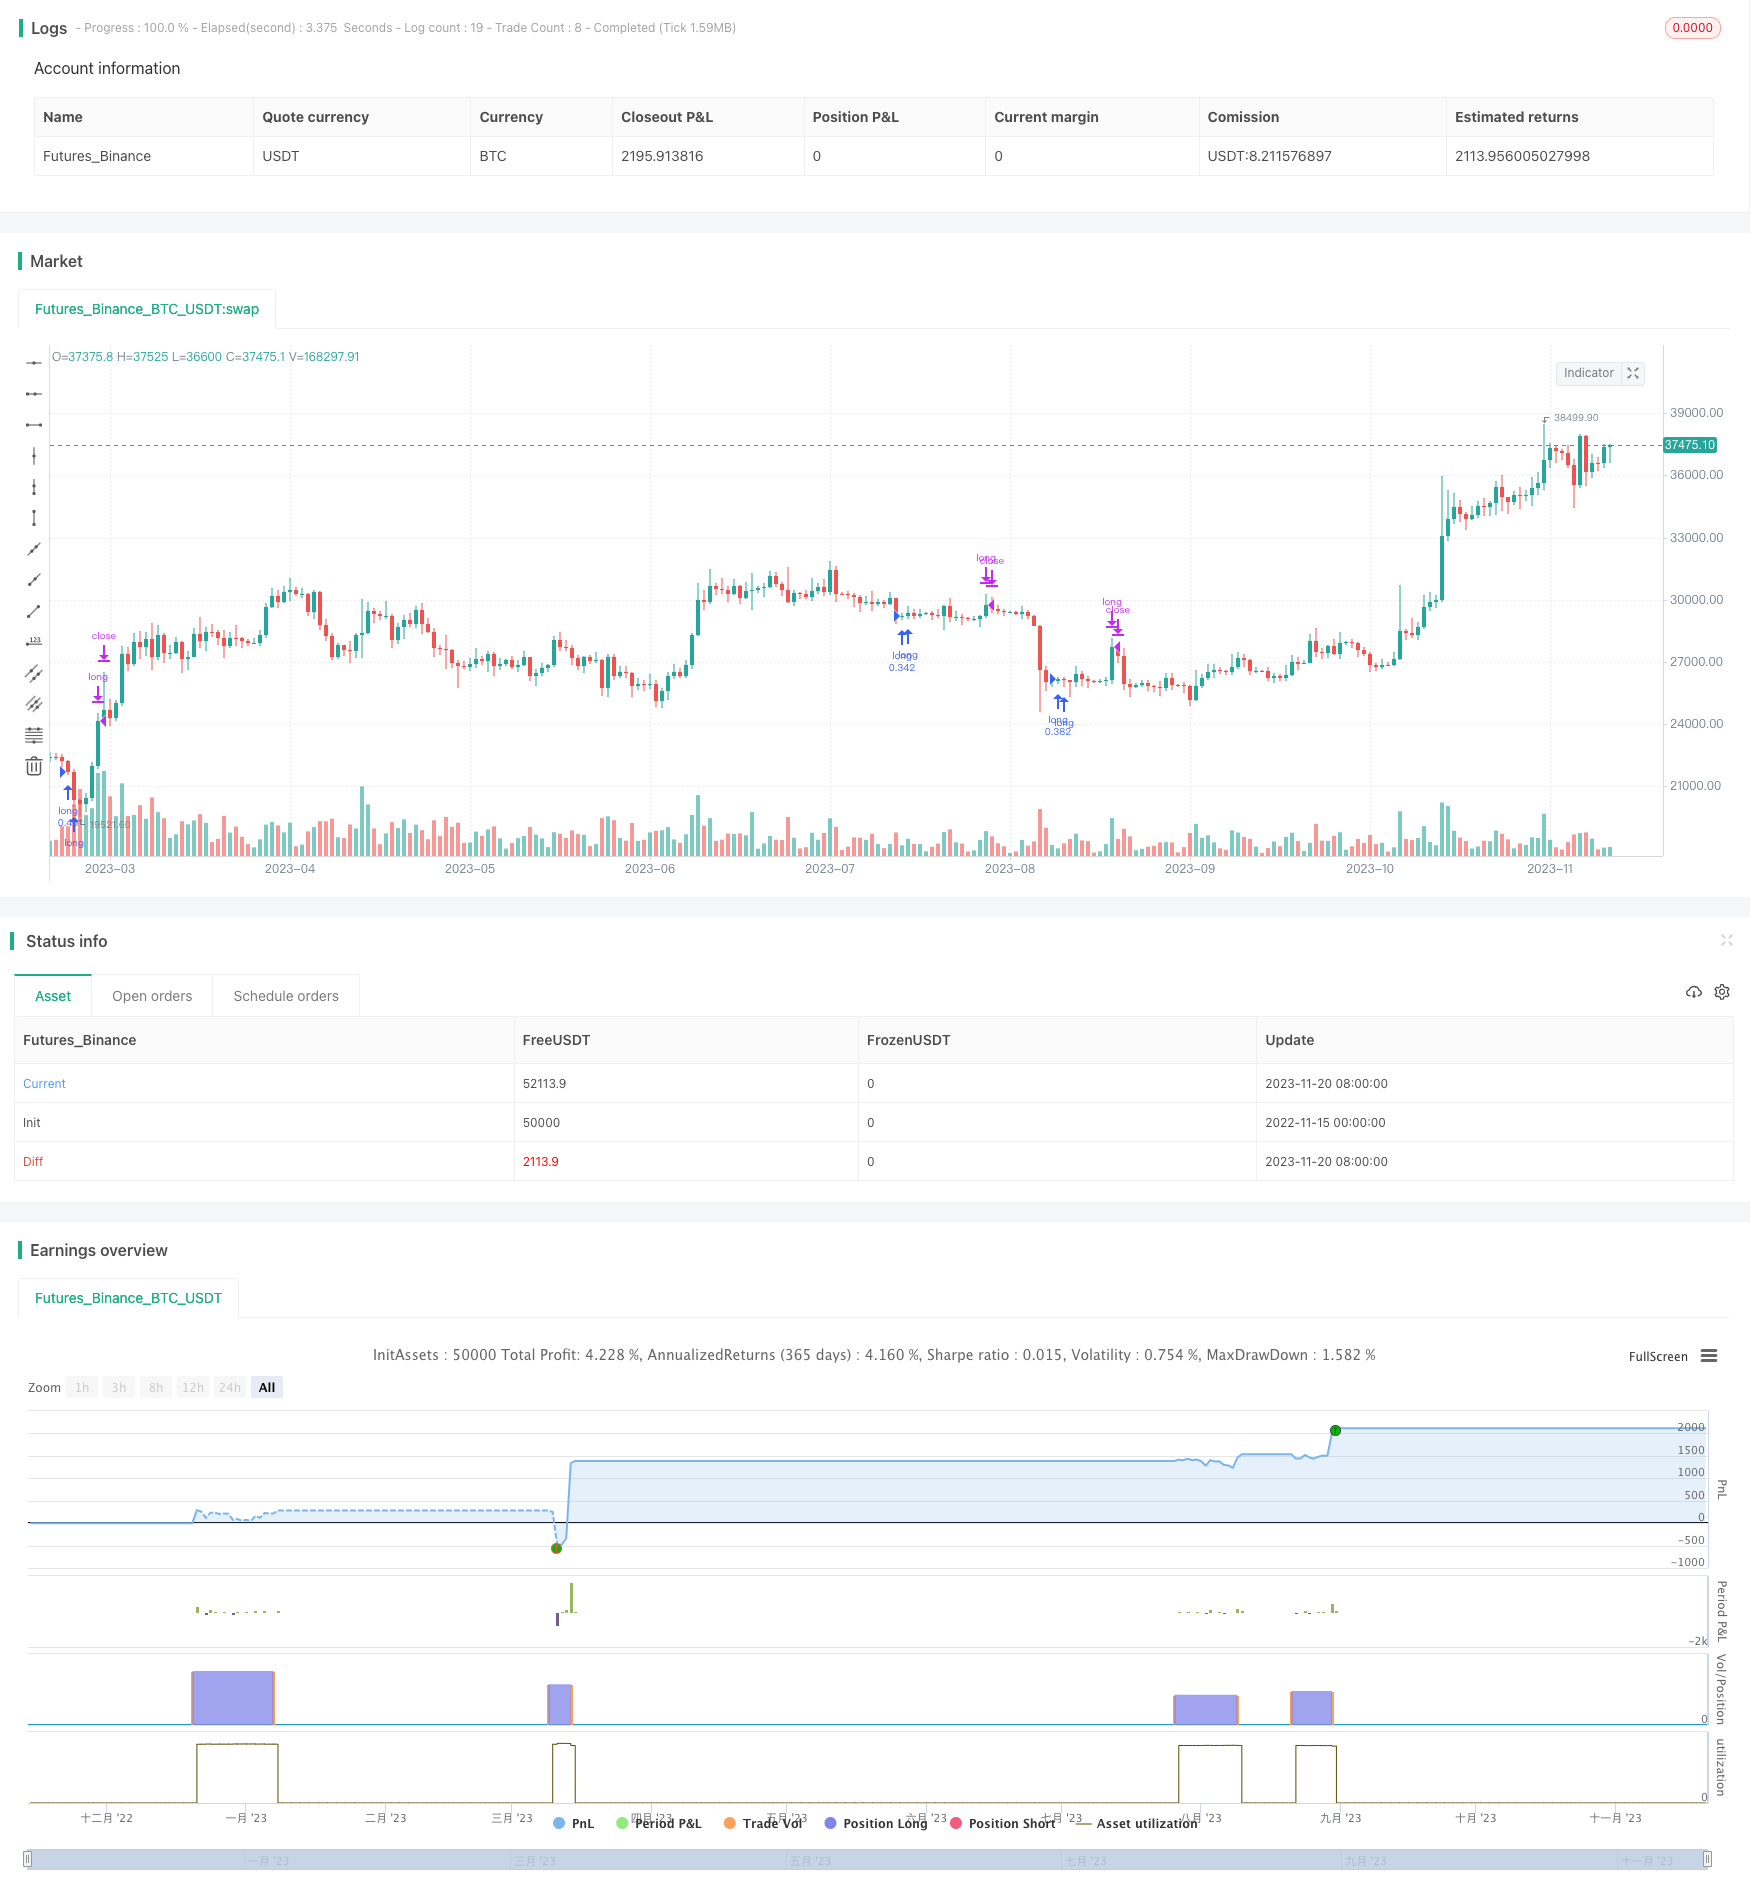
/*backtest
start: 2022-11-15 00:00:00
end: 2023-11-21 00:00:00
period: 1d
basePeriod: 1h
exchanges: [{"eid":"Futures_Binance","currency":"BTC_USDT"}]
*/

//@version=4

//study(title = "Bolinger strategy", overlay=true)
strategy("Bolinger strategy",currency="SEK",default_qty_value=10000,default_qty_type=strategy.cash,max_bars_back=50)
len = 5
src = close
up = rma(max(change(src), 0), len)
down = rma(-min(change(src), 0), len)
rsi = down == 0 ? 100 : up == 0 ? 0 : 100 - (100 / (1 + up / down))


bbw3level = input(15, title="bbw3")
bbr3level = input(0.45, title="bbr3level")
bbrlower = input(0.4480, title="bbrlower")
bbrhigher = input(0.4560, title="bbrhigher")
sincelowestmin = input(7, title="sincelowestmin")
sincelowestmax = input(57, title="sincelowestmax")


length = input(20, minval=1)
mult = 20
src3 = close[3]
basis3 = sma(src3, length)
dev3 = mult * stdev(src3, length)
upper3 = basis3 + dev3
lower3 = basis3 - dev3
bbr3 = (src3 - lower3)/(upper3 - lower3)
bbw3 = (upper3-lower3)/basis3*100


basis = sma(src, length)
dev = mult * stdev(src, length)
upper = basis + dev
lower = basis - dev
bbr = (src - lower)/(upper - lower)
bbw = (upper-lower)/basis*100

criteriamet = 0
crossUnderB0 = crossunder(bbr,0)

since_x_under = barssince(crossUnderB0)


sincelowest = barssince(close[6] > close[3] and close[5] > close[3] and close[4] > close[3] and close[2] > close[3] and close[1] > close[3] and close > close[3] and bbw3 > bbw3level and bbr3 < bbr3level) //  and bbr3 < 0

if sincelowest > sincelowestmin and sincelowest < sincelowestmax and bbr > bbrlower and bbr < bbrhigher
	criteriamet := 1
else
	criteriamet := 0
//plot (criteriamet)

//exit
exitmet = 0
if rsi > 70
	exitmet := 1
else
	exitmet := 0

if criteriamet == 1
	strategy.entry("long", strategy.long)
if exitmet == 1
	strategy.close("long")