The Dynamic Box Percentage Tracking Strategy

Author: ChaoZhang, Date: 2023-11-23 10:32:39
Tags:

img

Overview

This strategy uses percentage price changes to set entry lines and stop loss lines. It enters positions when prices break through the entry line and exits positions when prices fall below the stop loss line. Its main feature is that it only takes on one unit of risk, meaning that new positions will only be added after the previous position reaches a preset profit target.

Principles

The strategy first sets a benchmark price and uses 10% of that price as the price range - the upper bound is the entry line and the lower bound is the stop loss line. When prices break through the entry line, fixed quantities will be bought. When prices fall below the stop loss line, positions will be closed out. After making profits, the entry and stop loss lines will be adjusted by percentage to expand the profit range. This allows the strategy to track trend runs.

Another key point of the strategy is that it only takes on one unit of risk. That is, new positions will only be added after the current position reaches the profit target. The new positions will also follow the new entry and stop loss lines. This limits risk.

Advantage Analysis

This strategy combines the advantages of trailing stops and position sizing, allowing for effective risk control while being profitable.

  1. Using percentage ranges for entry and stop loss lines allows automatic trend tracking
  2. Risk is limited to single digits, avoiding major losses
  3. New positions are only added after profits, avoiding chasing trends
  4. Stop loss lines move up after profits, locking in gains

Risk Analysis

There are also some risks:

  1. If percentage ranges are too wide, risk may expand
  2. If ranges are too narrow, profit potential is limited
  3. Improper stop loss placement may lead to premature exiting
  4. Aggressive additions may amplify losses

These risks can be avoided by adjusting parameters like range sizes, entry filters etc.

Optimization

There is room for further optimization:

  1. Combining with trend indicators to determine trend direction
  2. Adding machine learning models for more adaptive lines
  3. Testing different addition conditions to lower risk
  4. Finding optimal holding periods through testing

Conclusion

This is a simple and practical percentage range-based system. Through parameter tuning and model optimization, this strategy can become a reliable trend tracking tool, generating stable outperformance for investors.
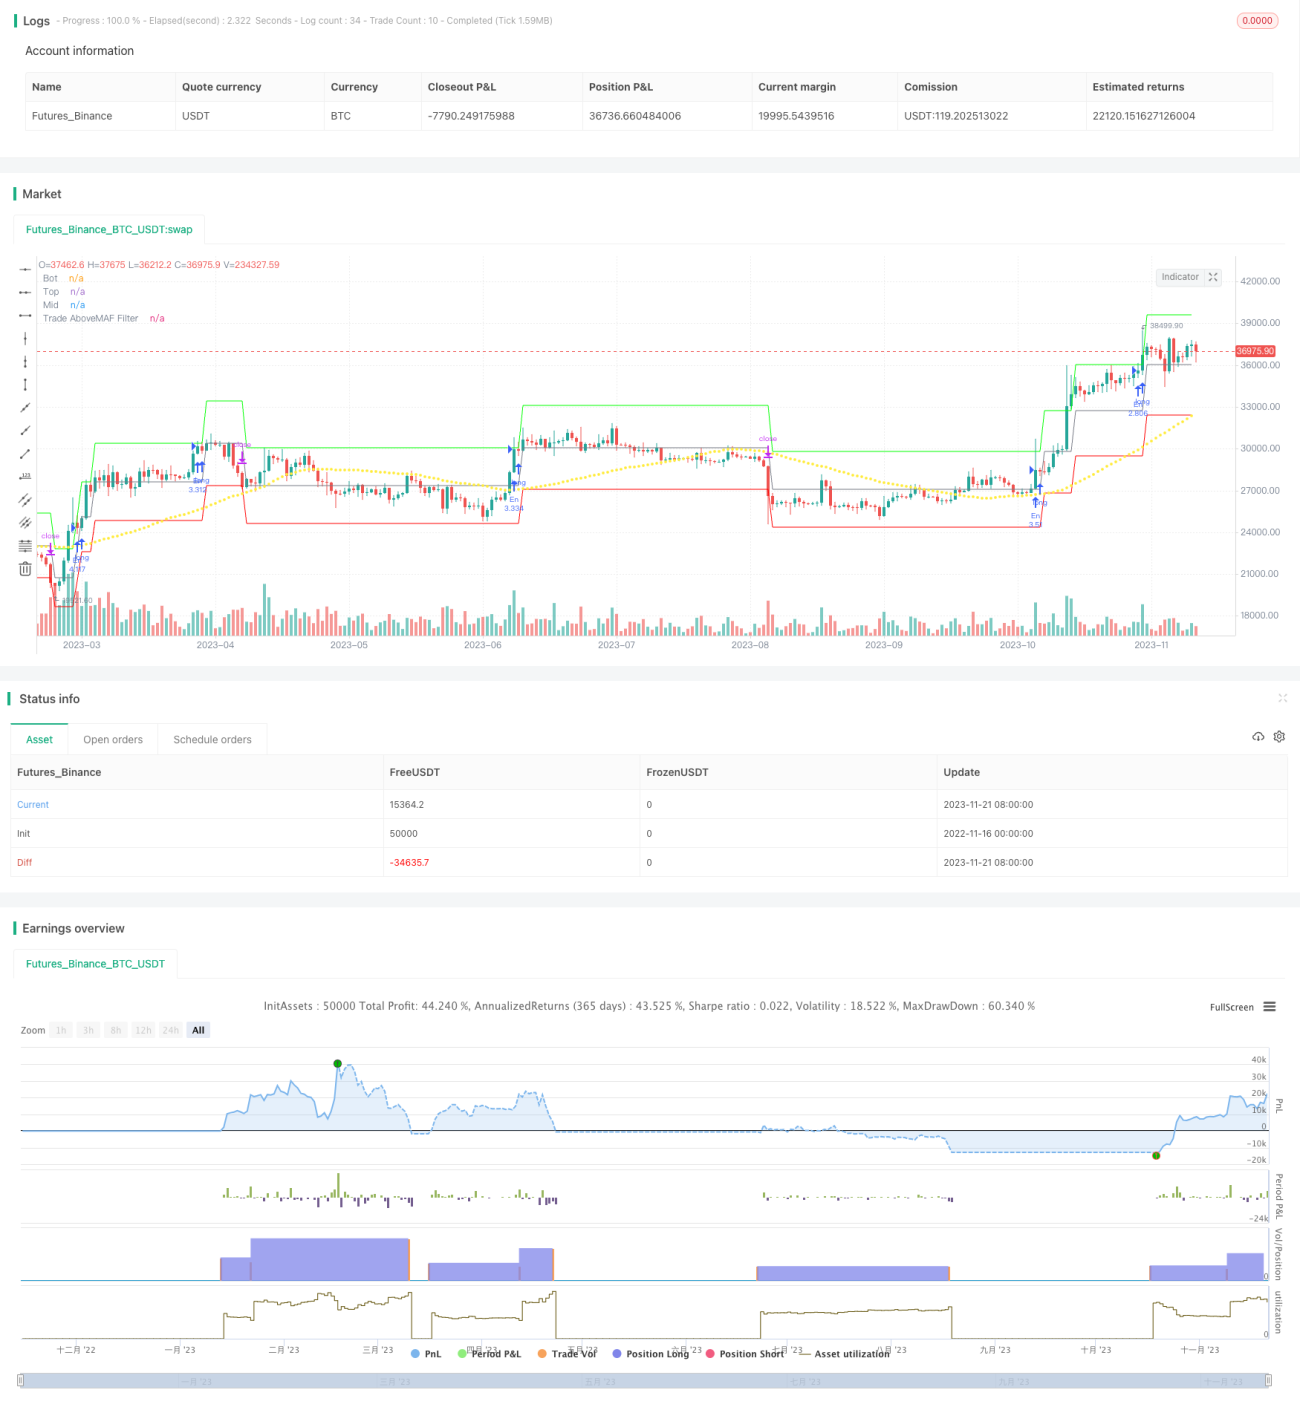

/*backtest
start: 2022-11-16 00:00:00
end: 2023-11-22 00:00:00
period: 1d
basePeriod: 1h
exchanges: [{"eid":"Futures_Binance","currency":"BTC_USDT"}]
*/

//@version=4
// This source code is subject to the terms of the Mozilla Public License 2.0 at https://mozilla.org/MPL/2.0/
// © HermanBrummer 4 April 2021

strategy ("The Box Percent Strat", shorttitle="The Box", overlay = true)

///     Designed for LONG only on Daily, 2D or 3D Charts
///     Uses fixed investment risk amount, meaning you're willing to lose that amount per trade
///     Limit buy to not overpay

RiskPerTrade            = input(10000, "Risk losing this much per trade", tooltip="This calculates how much you will lose based on difference between the entry price and stop loss price")
TradeAboveMAFilterPer   = input(50, "The System won't trade if price is below this MA")

UpBoxSize               = (input(10, "Box size in %") * 0.01)+1 // 1.1 == 10% up
DnBoxSize               = 1-(input(10, "Box size in %") * 0.01) // 0.9 == 10% dn


var FirstBar            = close > 0 ? close : na
var FirstTop            = FirstBar * UpBoxSize
var FirstBot            = FirstBar * DnBoxSize


var top                 = sma(FirstTop, 1)
var bot                 = sma(FirstBot, 1)

///     The Box Calcs
if  high[2] > top
    top                 := top * UpBoxSize
    bot                 := bot * UpBoxSize
if  low[1]  < bot
    top                 := top * DnBoxSize
    bot                 := bot * DnBoxSize

 
plot(bot,   "Bot",      #ff0000) // Green
plot(top,   "Top",      #00ff00) // Red

mid                     = ((top-bot)/2)+bot 
plot(mid,   "Mid", color.gray)

TradeAboveMAFilter      = sma(close, TradeAboveMAFilterPer)
plot(TradeAboveMAFilter, "Trade AboveMAF Filter", color.yellow, 3, style=plot.style_circles)

// col = high[1] < top and high >= top ? color.white : na
// bgcolor(col)


///     Shares
RiskRange                   = close * abs(DnBoxSize - 1) // 0.9 - 1 == 1.10 // 10% abs so you don't get a neg number NB NB
Shares                      = RiskPerTrade / RiskRange 
//plot(close-RiskRange, "RiskRange", color.fuchsia)

Enter   =   high >= top
             and close[1] > TradeAboveMAFilter
             and strategy.opentrades[0] == strategy.opentrades[1]
             and strategy.opentrades[1] == strategy.opentrades[2] 
             and strategy.opentrades[2] == strategy.opentrades[3]
             and strategy.opentrades[3] == strategy.opentrades[4] 
             and strategy.opentrades[4] == strategy.opentrades[5]
             and strategy.opentrades[5] == strategy.opentrades[6]
             // won't enter if new positon was taken in the last 6 bars
             // need better code for this.

///     Buy & Sell
//  (new highs)    and  (Close above moving average filter) and (No new trades were taken receently)
if  Enter //(high >= top)  and  (close[1] > TradeAboveMAFilter) and strategy.opentrades[0] == strategy.opentrades[1] 
    strategy.order("En", strategy.long, qty=Shares, limit=top)//, stop=top)
    
//barcolor(strategy.position_size != 0 ? #00ff00 : color.gray)


// ///     If ONE Position THEN this Stop Because: 
// if  strategy.position_size == 1
//     strategy.exit("Ex", "En", stop=bot)
///     If it has more than one trad OPEN
if  strategy.position_size > 0
    strategy.exit("Ex", "En", stop=bot[2] )   // puts stop on old bot

//plot(strategy.position_avg_price, "Avg Price", color.yellow)


More