Dual Rate of Change Momentum Indicator Trading Strategy

Overview
This is a trading strategy based on the Dual Rate of Change Momentum Indicator (DRCMI). It generates trading signals by gauging market momentum across multiple timeframes.
Strategy Logic
The core of this strategy is the DRCMI, which is a weighted average of multiple Rate of Change (ROC) indicators across different periods. Specifically, it incorporates 6-period, 10-period, 15-period, and 20-period ROC. The 6-period and 10-period ROC have a weight of 1, while the 15-period ROC has a weight of 2, and the 20-period ROC has a weight of 3. Thus, longer-term ROC is given greater emphasis.
By combining ROC across timeframes, the DRCMI reflects both short-term and longer-term momentum. When it is positive, it indicates an uptrend in both the short and long run. When negative, it signals a downtrend. The intensity of the momentum is also captured in the amplitude of DRCMI fluctuations.
Trading signals are generated based on the cyclicality of DRCMI. A long position is initiated when DRCMI crosses above 0, while a short position is initiated when it crosses below 0.
Advantage Analysis
The main advantages of this strategy are:
- Integrates momentum across periods for more accurate trend identification.
- Better captures cyclicality compared to single timeframe ROC.
- Reasonable weighting methodology focuses on longer-term to filter noise.
- Simple to implement with just a single indicator for signals.
- Customizable lookback periods suit different products.
Risk Analysis
There are also some risks to consider:
- Sensitivity to parameters with multiple integrated timeframes.
- May overlook other factors by only considering momentum.
- Potential lag requires optimized entry and exit.
- Stop loss still necessary during high volatility.
To mitigate risks, stop losses should be utilized along with optimization of the DRCMI parameters and incorporation of additional technical indicators.
Optimization Directions
Some ways to improve the strategy:
- Optimize DRCMI parameters like periods and weights.
- Incorporate trend indicators to dynamically adjust parameters based on market regime.
- Implement dynamic stops to lock in profits.
- Consider intermarket relationships with correlation analysis to construct spreads.
Conclusion
This strategy generates trading signals by condensing momentum from multiple timeframes into the DRCMI indicator. It is simple yet effective in profiting from momentum swings. However, parameter tuning and stop loss implementation requires further optimization, and combining DRCMI with additional technical indicators can improve performance.
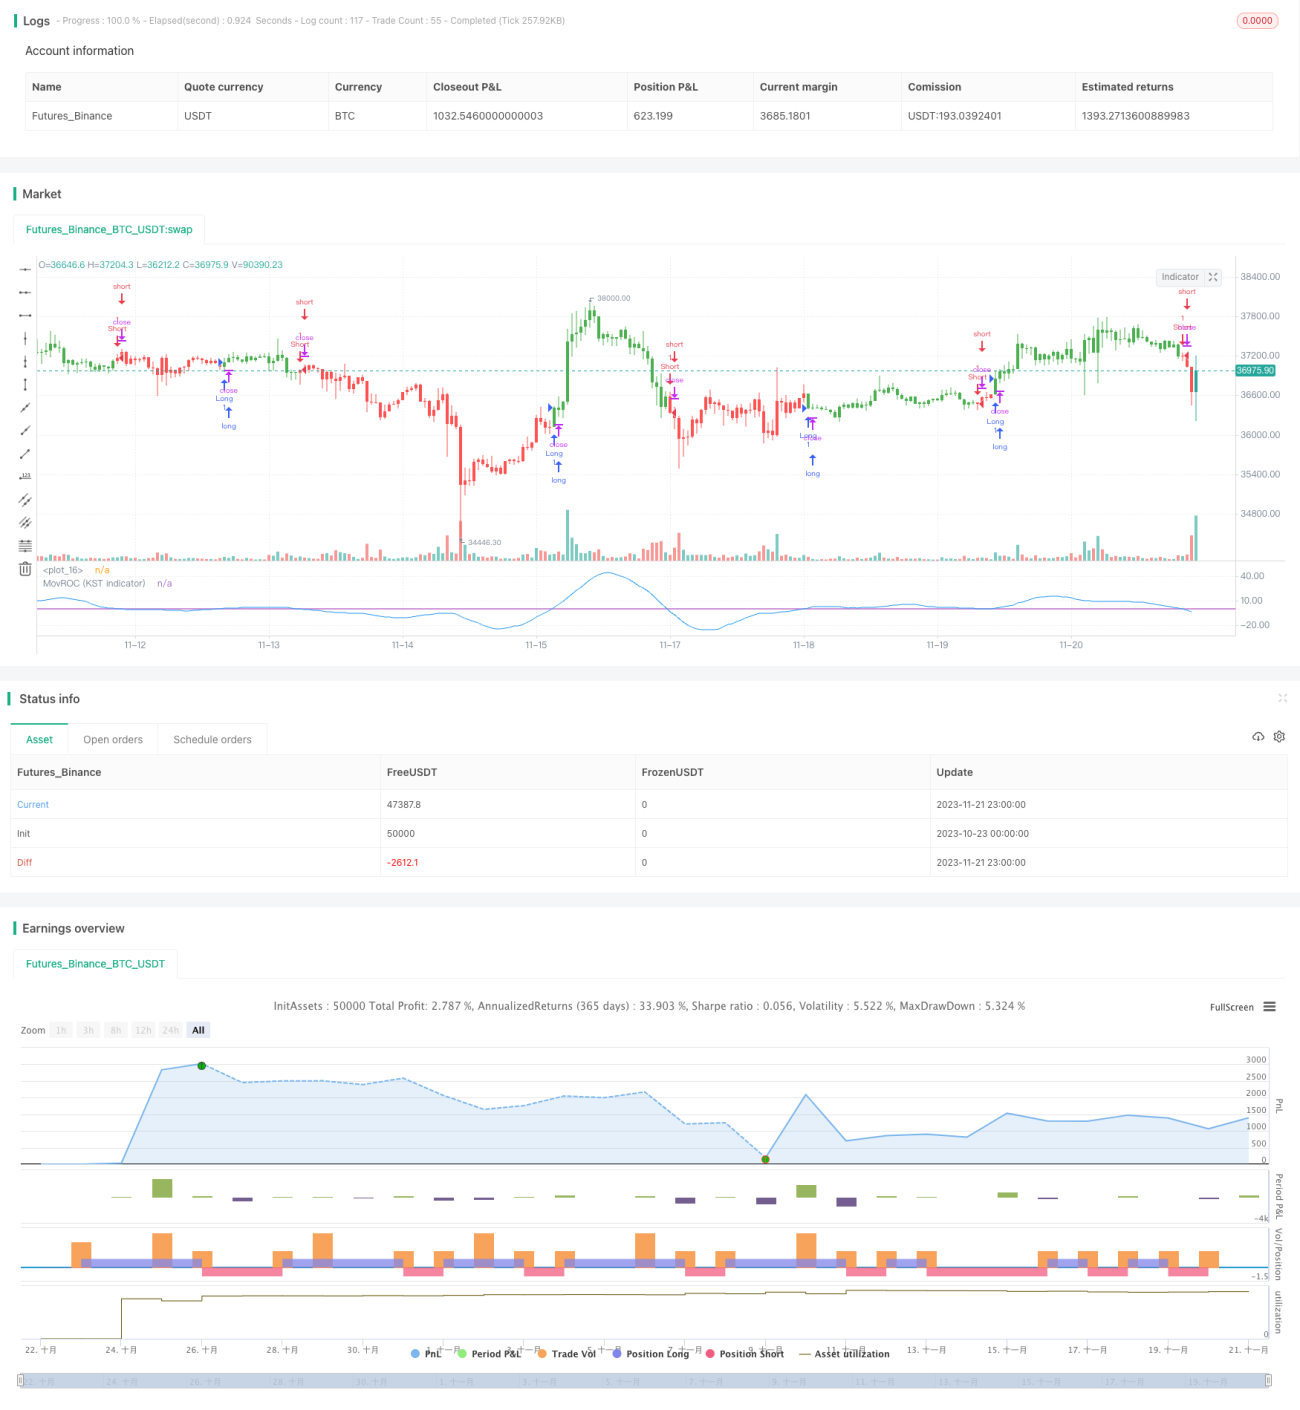
/*backtest
start: 2023-10-23 00:00:00
end: 2023-11-22 00:00:00
period: 1h
basePeriod: 15m
exchanges: [{"eid":"Futures_Binance","currency":"BTC_USDT"}]
*/

//@version=2
////////////////////////////////////////////////////////////
//  Copyright by HPotter v1.0 20/09/2017
// This indicator really is the KST indicator presented by Martin Pring. - 1