Cloud Soaring High Yield Daily Trading Strategy

Overview
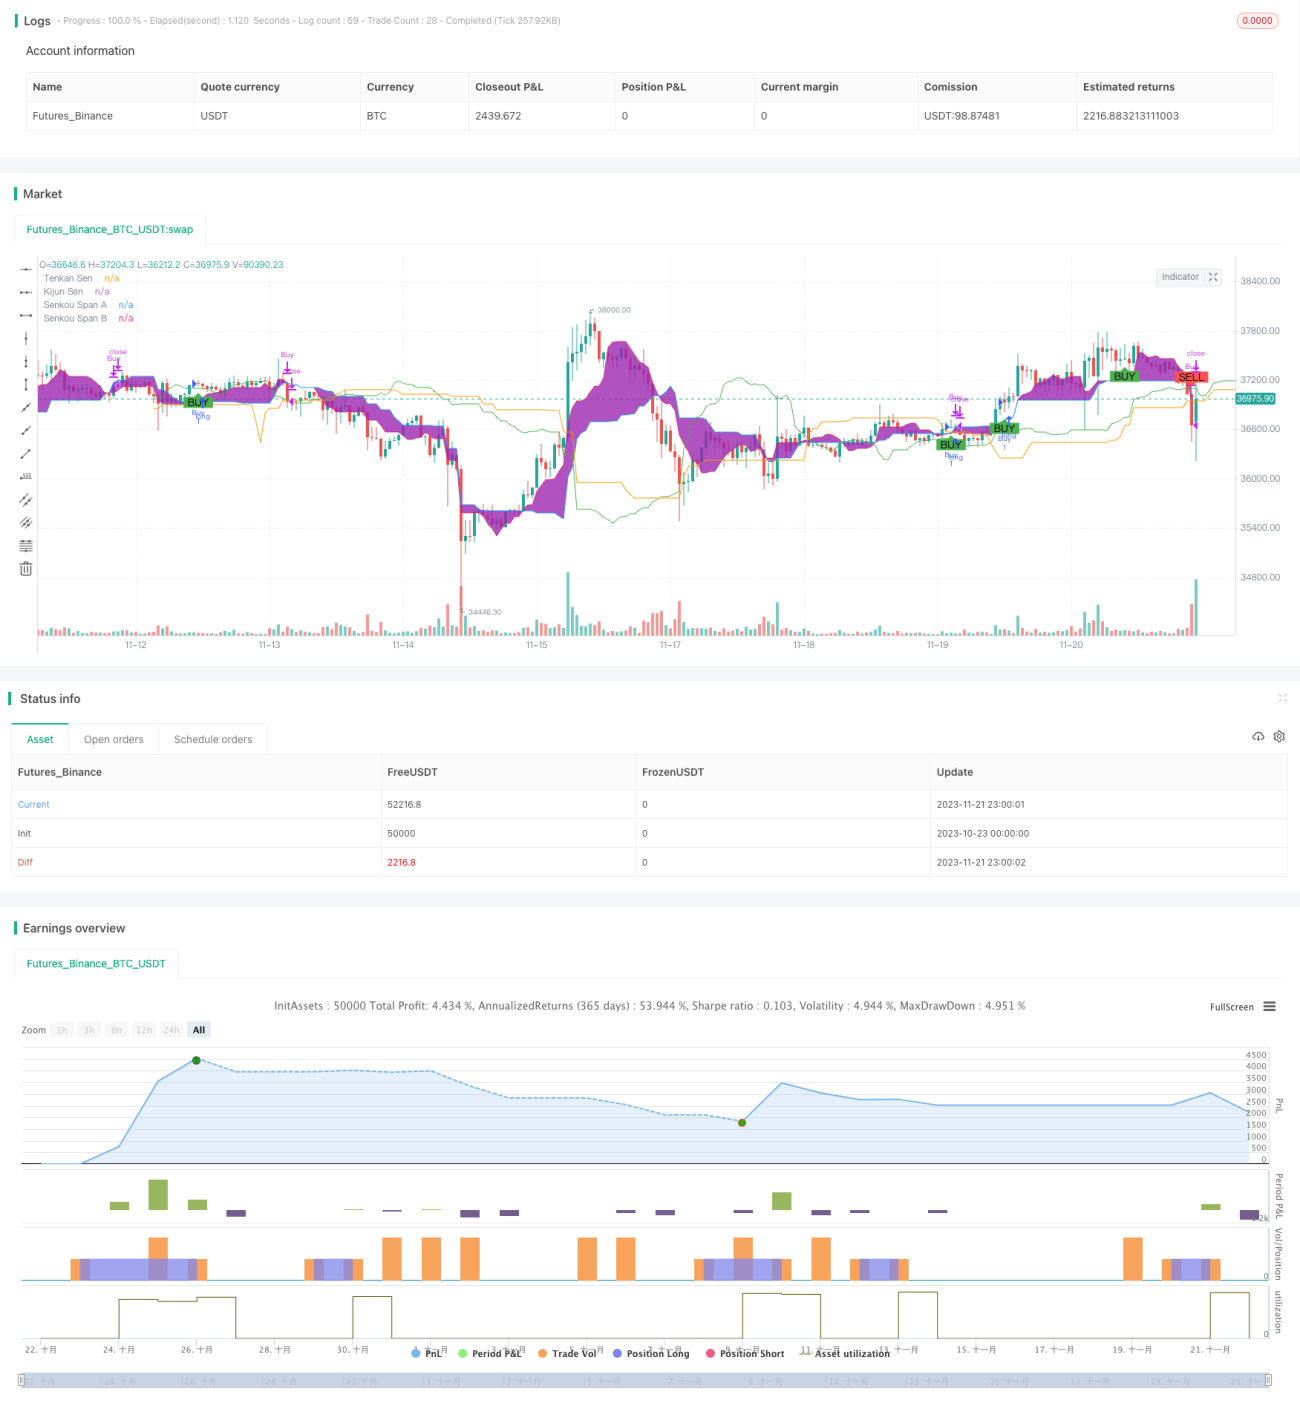
This strategy leverages the renowned Ichimoku Kinko Hyo technology indicator to identify trend and momentum of asset prices and enables automated intraday trading. It goes long when price breaks through the cloud and the Tenkan line crosses over the Kijun line, and closes positions when the lines cross under or prices break down the cloud support level.
Principles
The core indicators consist of Tenkan line, Kijun line, Senkou Span A and Senkou Span B of the Ichimoku system. The buy signal activates when prices trade above the cloud and the Tenkan line crosses over the Kijun line. The sell signal triggers when the Tenkan line crosses below the Kijun line or prices drop below the cloud.
The strategy combines both trend following and momentum characteristics. The Tenkan and Kijun lines represent short-term and medium-term momentum respectively by averaging highest high and lowest low over different lookback periods. The cloud on the other hand identifies longer term support and resistance levels. When the momentum gauge Tenkan line crosses over the Kijun line, it signals strengthening upside momentum and prices tend to push higher. Together with prices breaking out above the top of the cloud decisively, it gives the confirmation that the longer term trend has turned bullish, hence a buy signal is generated.
On the contrary, when the Tenkan line crosses below the Kijun line, momentum flips bearish. Or when prices collapse below the cloud support, the long term trend turns downward. The sell signals get activated. This wax and wane configuration avoids chasing tops and selling lows. It locks in the optimal buy and sell points when both short term and long term trends align in the same direction.
Advantage Analysis
The biggest advantage of the Cloud Soaring High Yield strategy is integrating both trend and momentum lenses, achieving an excellent balance between trading frequency and profitability. It ensures adequate trading opportunities while avoiding excessive whipsaws from chasing surges and catching falls. The versatility and reliability of Ichimoku as a evergreen indicator cannot be understated.
What’s worth highlighting in particular is the sophistication in timing the strategy’s entry and exit signals. The adaptive parameter configuration of the Tenkan and Kijun lines avoids the subjectivity and restrictedness of manual parameter tuning. The cloud further acts as the filter to pinpoint the optimal ticks when both short term and long term trends concur. On top of that, the combination of crossovers and breakouts enriches the strategy by encapsulating both momentum and trend following, thereby enhancing its real world performance. In a nutshell, Cloud Soaring combines higher win rates and more precise entry/exit control to stand out from average strategies.
Risk Analysis
One caveat is that the cloud bands can expand or contract abnormally during certain periods, impacting the frequency of signal generation. In range-bound, low volatility environments with unclear trends, fewer trade signals may occur. In addition, with multiple intertwined components of Ichimoku, dysfunction of individual building blocks can dampen applicability of this strategy.
To address these weaknesses, dynamic adjustment of Ichimoku parameters can be explored for optimization, such as narrowing the cloud bands during low volatility regimes to increase participation rate. Supplementary indicators like trading volumes can also help validate signals and avoid false signals. Overall despite the limitations stated, satisfactory live performance of the Cloud Soaring strategy can still be achieved in most market conditions.
Enhancement Opportunities
The strategy can be further improved by introducing more complementary technical indicators, like Bollinger Bands, to refine entry and exit levels. Dynamic mechanism of tuning Ichimoku parameter settings can also be established, allowing alternating configurations based on changing volatility and trend landscapes, hence lifting adaptiveness.
In essence, the framework of Ichimoku filter and momentum oscillator crossover is robust. But methods like machine learning can be leveraged to enable smarter, more dynamic parameter configuration, range adjustment and stop loss/profit taking criteria setting - further optimizing the precise timing when long term and short term trends align.
Conclusion
The Cloud Soaring High Yield Ichimoku Trading Strategy succeeds in blending trend regime recognition and momentum indication for automated entries and exits. Its scientifically superior algorithms in locating buys and sells provide compelling solutions for those pursuing transitions between long term and short term trends while demanding high win rates. Moving forward, with ample room for intelligent dynamic parameter tuning, this strategy is poised to deliver even more exceptional outcomes.
- 1