CCTBBO Reversal Tracking Strategy

Overview
This strategy is based on the CCT Bollinger Band Oscillator (CCTBO) indicator developed by Steve Karnish. It identifies price reversals by detecting price breakouts of moving averages combined with a trailing stop mechanism.
Strategy Logic
The strategy uses high price as the source data to calculate the value of CCTBBO. The oscillator fluctuates between -200 and 200, where 0 represents the mean price minus 2 standard deviations and 100 is the mean price plus 2 standard deviations. Trading signals are generated when the oscillator crosses over or falls below its EMA line. Specifically, when the oscillator crosses above its EMA line and the distance between them is greater than the set margin value, a long position is opened. When the oscillator falls below its EMA line and the distance is less than the negative set margin value, a short position is opened. Position size is calculated according to the set percentage. In addition, the strategy uses a trailing stop loss based on percentage price change or number of tick movements to exit positions.
Advantage Analysis
- Uses the influential CCT Bollinger Band Oscillator indicator to reduce false signals
- Combining EMA line and margin condition filters signals to avoid excessive invalid trades during oscillations
- Applies trailing stop loss mechanism to stop loss in a timely manner when losses are too large
Risk Analysis
- CCT oscillator itself has some lag, thus missing the best timing for price reversals
- Excessive margin value and too short EMA period settings increase trade frequency and risk
- Trailing stop loss set too loose increases loss risk
Risk Management:
- Adjust EMA line period, use longer period to filter
- Appropriately adjust margin value to balance risk and return
- Reduce position percentage to control single loss
- Reasonably reduce trailing stop loss range for faster stopping
Optimization Directions
The strategy can be optimized in the following aspects:
- Replace with other volatility indicators like Bollinger Bands, Keltner Channels, etc to determine entries and exits
- Add other filtering indicators like MACD, RSI to ensure signal reliability
- Use machine learning algorithms to auto-optimize parameters like EMA period, margin values, etc
- Add position sizing mechanisms like fixed fractional, Martingale to control trade risk
- Optimize trailing stop loss mechanisms using volatility or ATR stops
Summary
In summary, this is a quantitative trading strategy for identifying price reversals using the CCT Bollinger Band indicator. It has certain advantages but also room for improvement. By optimizing parameters, adding filters, using Feature engineering, introducing machine learning, etc, the stability and profitability of this strategy can be further enhanced.
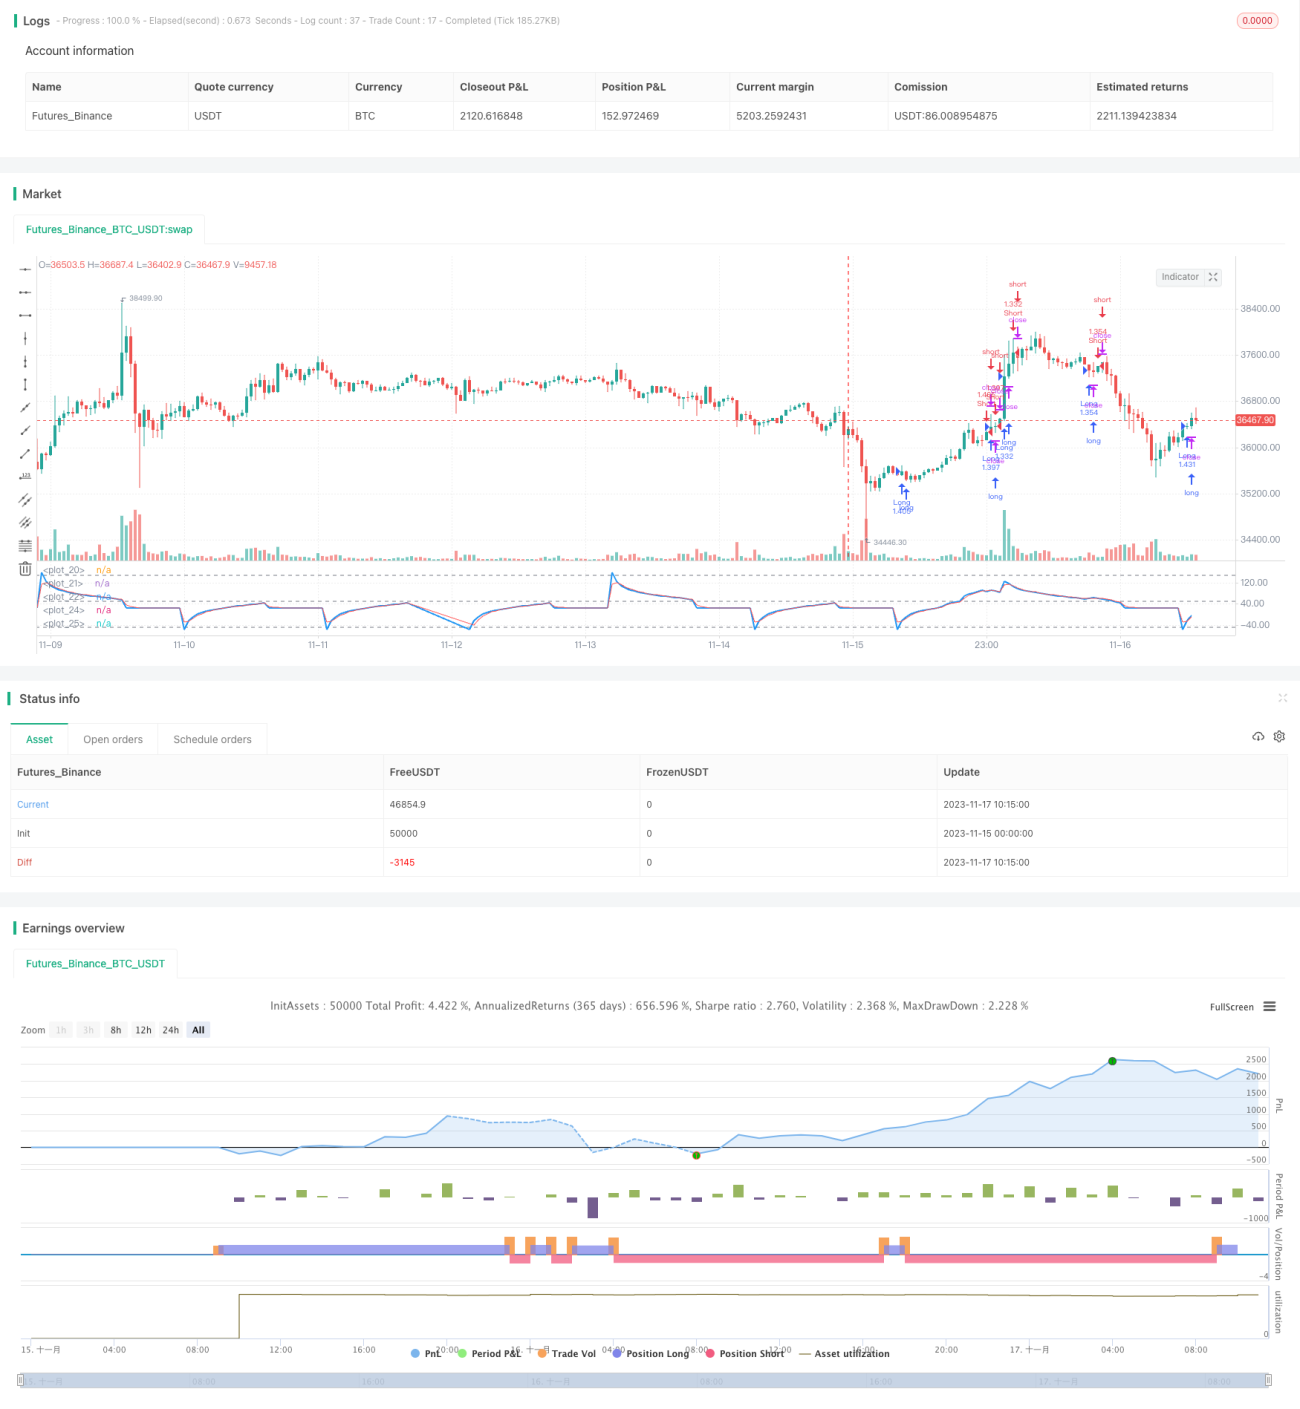
/*backtest
start: 2023-11-15 00:00:00
end: 2023-11-17 11:00:00
period: 45m
basePeriod: 5m
exchanges: [{"eid":"Futures_Binance","currency":"BTC_USDT"}]
*/

//@version=2
// This strategy is based on the CCT Bollinger Band Oscillator (CCTBO)
// developed by Steve Karnish of Cedar Creek Trading and coded by LazyBear.
// Indicator is available here https://www.tradingview.com/v/iA4XGCJW/- 1