Momentum Breakout Strategy Based on Internal Amplitude Stop Loss

Author: ChaoZhang, Date: 2023-11-23 14:14:58
Tags:

img

Overview

This strategy identifies abnormally surging K-lines to judge whether there is a one-sided market with bursting volatility. When an abnormally surging K-line is identified, it will set a take profit limit order near the high of that K-line, while also setting a stop loss near the low of the previous K-line, forming a long position with high leverage risk control. The strategy continuously monitors the stop loss line, and will immediately cancel the order to stop loss if the price breaks below the stop loss line.

Strategy Principle

This strategy mainly judges the formation of abnormally surging K-lines. When a K-line with close>open and high<high[1] and low>low[1] appears, it believes there is a current period of abnormally surging market. A long entry signal will be generated, with entry price near the highest price of the current K-line. The stop loss price is also set near the lowest price of the previous K-line to form a high leverage risk control model. Risk control is achieved by continuously monitoring the price breakout of the stop loss line.

Advantage Analysis

The biggest advantage of this strategy is that it can capture short-term bursting volatility in the market to achieve ultra-high frequency trading. At the same time, by setting a larger stop loss range, high leverage can be used for risk-controlled trading to obtain greater returns. In addition, the strategy realizes automatic monitoring of the stop loss line. When the price breaks through the stop loss line downward, it can quickly stop loss to effectively control trading risks.

Risk Analysis

The main risk of this strategy is that the judgement of abnormal surging is inaccurate, and it is unable to effectively capture the bursting volatility of the market, resulting in a higher probability of misjudgment of trading signals. In addition, the setting of stop loss positions will also have a great impact on trading risks and returns. If the stop loss is too loose, the trading loss risk will increase. If the stop loss is too tight, it may not be able to effectively track the gains in the market. A large amount of backtesting is needed to optimize the stop loss position.

Optimization Directions

The strategy can be optimized in the following aspects:

  1. The criteria for judging abnormal surges can introduce more indicators or deep learning models to assist in judgments to improve the accuracy of trading signal judgments in the strategy.

  2. The setting of stop loss positions can undergo a large amount of statistical and optimization analysis to find better stop loss positions to balance trading risks and return levels.

  3. More high-frequency trading risk control mechanisms can be introduced, such as transaction volume filtering, range breakout verification, etc., to avoid the probability of being trapped.

  4. The entry criteria of the strategy can be adjusted and need not be limited to abnormal surging K-lines. More indicators and models can be combined to make judgments and form a multiple verification mechanism.

Summary

This strategy is a typical high-frequency trading strategy, belonging to a short-term breakout strategy. It captures the bursting volatility in market movements to achieve ultra-high frequency trading. At the same time, it uses stop loss risk control and high leverage mechanisms to control risks. The strategy has large room for optimization, and can be adjusted and optimized from multiple angles. The ultimate goal is to obtain higher returns from ultra-high frequency trading while controlling risks.
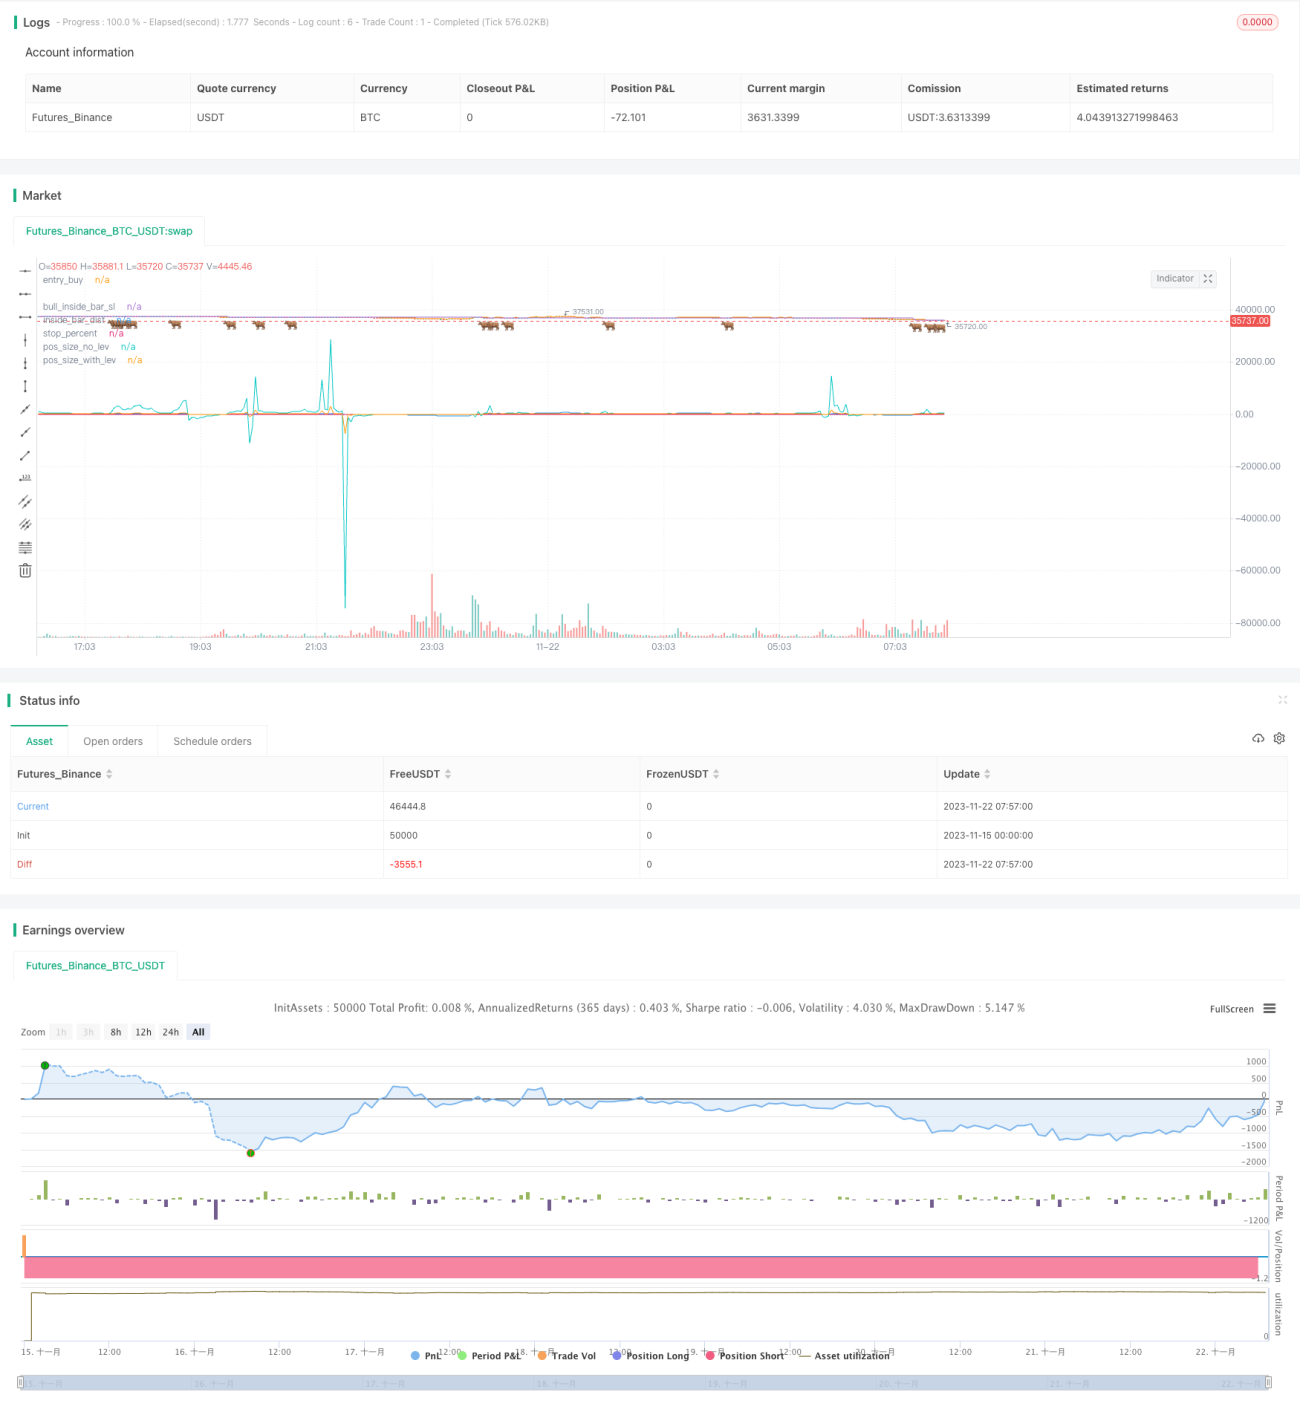

/*backtest
start: 2023-11-15 00:00:00
end: 2023-11-22 08:00:00
period: 3m
basePeriod: 1m
exchanges: [{"eid":"Futures_Binance","currency":"BTC_USDT"}]
*/

// LOVE JOY PEACE PATIENCE KINDNESS GOODNESS FAITHFULNESS GENTLENESS SELF-CONTROL 
// This source code is subject to the terms of the Mozilla Public License 2.0 at https://mozilla.org/MPL/2.0/
// © JoshuaMcGowan
// I needed to test/verify the functionality for canceling an open limit order in a strategy and also work thru the pieces needed to set the position sizing so each loss is a set amount. 
// This is not meant to be dropped into a chart but rather gives the code/logic in order to use in your own script w/alerts or strategy. Hope it helps. 
 
//@version=4
strategy("Strategy Test - Cancel Limit Order and Position Sizing", overlay=true, precision=4)
 
/////////////////
// Backtest Period Selection
 
testStartYear = input(2020, "Backtest Start Year",minval=1980)
testStartMonth = input(2, "Backtest Start Month",minval=1,maxval=12)
testStartDay = input(1, "Backtest Start Day",minval=1,maxval=31)
testPeriodStart = timestamp(testStartYear,testStartMonth,testStartDay,0,0)
 
testStopYear = input(2020, "Backtest Stop Year",minval=1980)
testStopMonth = input(12, "Backtest Stop Month",minval=1,maxval=12)
testStopDay = input(31, "Backtest Stop Day",minval=1,maxval=31)
testPeriodStop = timestamp(testStopYear,testStopMonth,testStopDay,0,0)
 
testPeriod() => time >= true
 
//////////////
// Inside Bar
bull_inside_bar = close>open and high<high[1] and low>low[1]

// Set Levels
bull_inside_bar_sl = valuewhen(bull_inside_bar, low[1], 0) - (1*syminfo.mintick)
bull_breakout_price = valuewhen(bull_inside_bar, high, 0) + (1*syminfo.mintick)
entry_buy   = high
inside_bar_dist = entry_buy - bull_inside_bar_sl
inside_bar_be = entry_buy + (inside_bar_dist * 1)
inside_bar_tgt = entry_buy + (inside_bar_dist * 2)

///////////////////
// Position Sizing 
//////////////////
// For each trade setup that fires in this scenario we want to set our total loss amount in USD, so every trade that loses is lets say $1 and the 2:1 target would be $2 in this example. 
// The math logic for this take the risk amount and divide by the stop percentage, take that number and divide by leverage amount chosen. Stop percentage is a variable below if questions on that. 
//
// Taken from @JoshuaMorris (shout out to the UK peeps) position sizing google doc so thank you sir. 
// Would be used if risking based on percentage of a portfolio. Leaving code snippets here in case that's the direction someone wants to go. 
// xbt_price = security("BITMEX:XBTUSD", "D", close)
// account_size_xbt = input(1, "Account Size (XBT)", type=input.float)
// account_size_usd = (account_size_xbt * xbt_price)
// percentage_risk = input(0.01, "Personal Risk Percent - Default is 1%", type=input.float)
// personal_risk = (account_size_usd * percentage_risk)
// position_size_usd = (personal_risk) / risk_percent
// leverage_req = position_size_usd / account_size_usd

// Will want to hard code leverage as 1x, 5x, 10x etc and dont need it to automagically be set as is above. If you're doing 100x you are gnarly haha. 
leverage_amount = input(title="Leverage Amount Desired", type=input.integer, defval=10, options=[1, 2, 3, 5, 10, 25, 50, 100])
risk_amount = input(title="Risk Total Per Trade in USD", type=input.integer, defval=1, minval=1, step=1)

// Reminder this is for Longs. Math needs to be changed a bit for Shorts. This is the information using the long/short tool would give us if doing manually. 
stop_percent = inside_bar_dist / (entry_buy)
pos_size_no_lev = risk_amount / stop_percent
pos_size_with_lev = pos_size_no_lev / leverage_amount 

//////////////
// Strategy Section

if testPeriod()
    strategy.entry(id="Long", long=true, qty=1, limit=9320.00, when=bull_inside_bar)
    strategy.cancel(id="Long", when = low < 9310)
// as a test swap the price to be above the limit or below to see the cancel in play.
 
//////////////
// Plot Section
plotchar(bull_inside_bar, title="bull_inside_bar", char="🐂", location=location.belowbar, offset=-0, color=color.green, transp=25)
plot(bull_inside_bar_sl, title="bull_inside_bar_sl", transp=100)
plot(entry_buy, title="entry_buy", transp=100)
plot(inside_bar_dist, title="inside_bar_dist", transp=100)
plot(stop_percent, title="stop_percent", transp=100)
plot(pos_size_no_lev, title="pos_size_no_lev", transp=100)
plot(pos_size_with_lev, title="pos_size_with_lev", transp=100)

// Hidden Plots // For Data Window Eyes Only // 
// plot(longCondition==true?1:0, title="Long Condition", transp=100)
// plot(xbt_price, title="XBT Price", transp=100)
// plot(account_size_usd, title="Account Size USD", transp=100)
// plot(risk_percent, title="risk_percent", transp=100)
// plot(position_size_usd, title="position_size_usd", transp=100)
// plot(leverage_req, title="leverage_req", transp=100)

// END //

More