Bi-Directional Trend Tracking Moving Average Crossover Strategy

1
Follow
1778
Followers
Overview
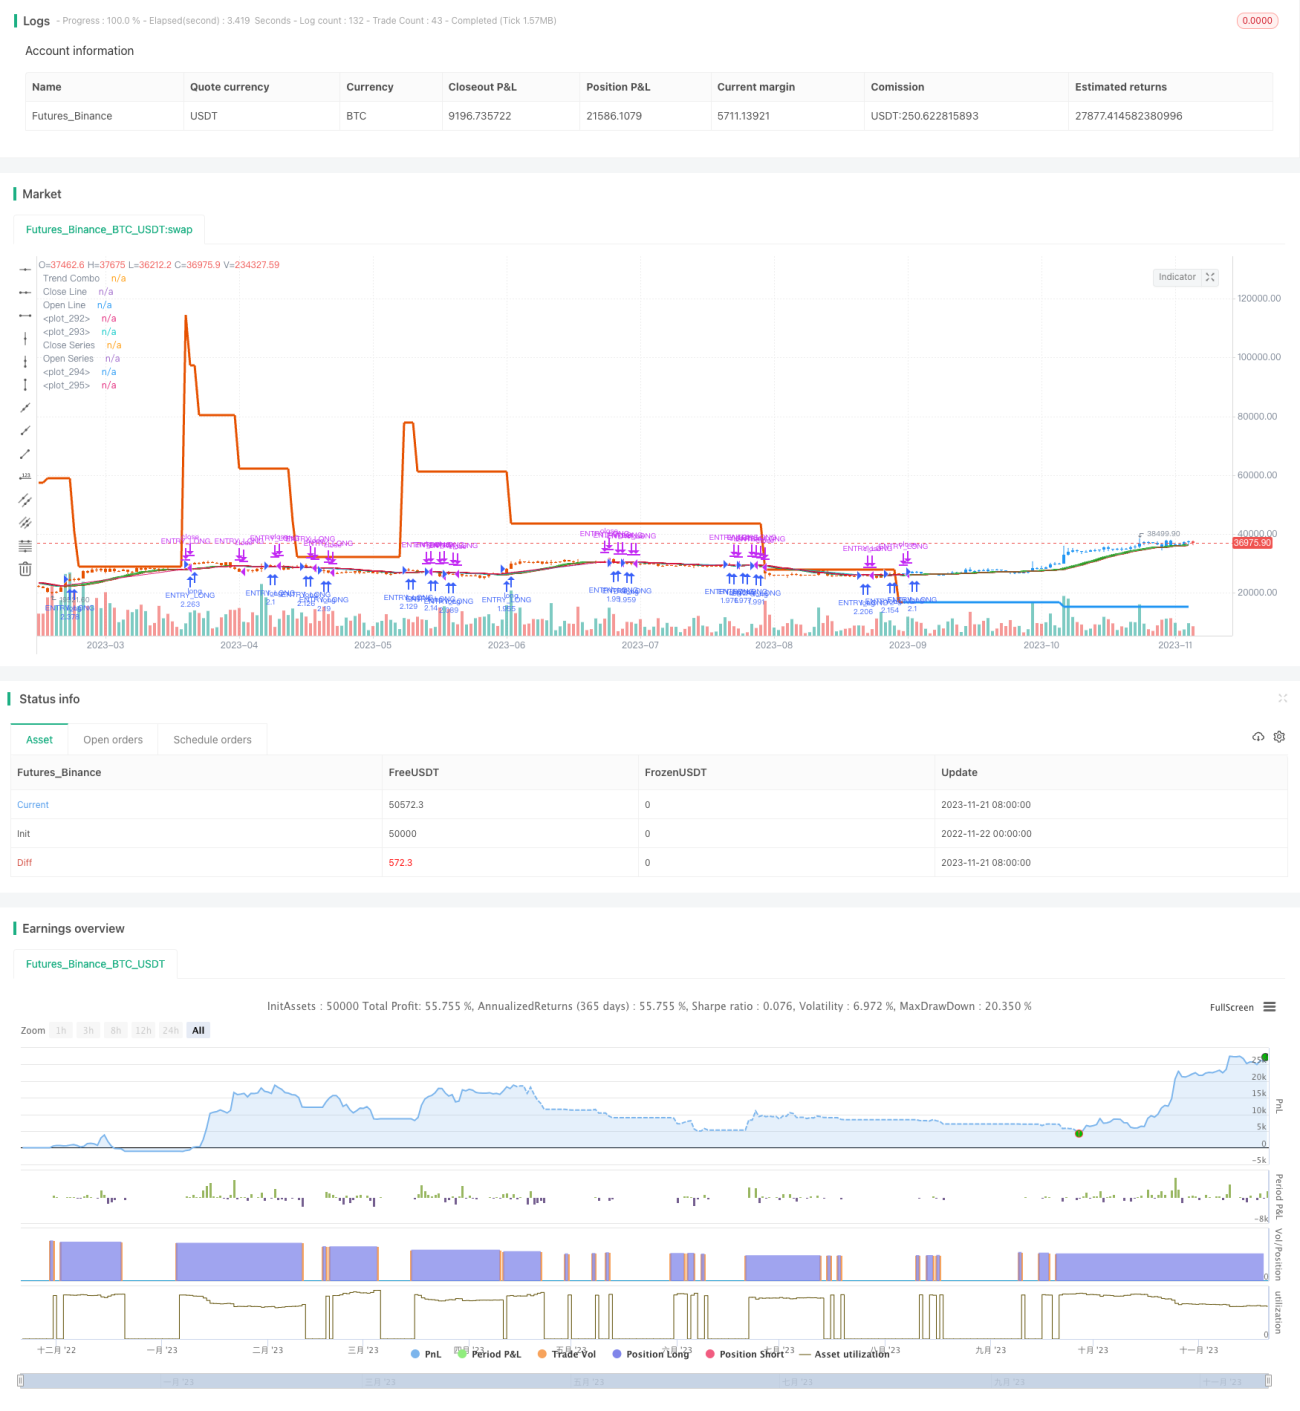
This strategy calculates bi-directional smoothed moving averages combined with a trend indicator to implement an automated trend tracking crossover trading strategy. The strategy aims to track long-term trends and achieve higher returns during strong trends.
Strategy Logic
- Calculate bi-directional smoothed moving averages of the asset price, including the open price moving average and the close price moving average.
- Use correlation coefficient and ATR indicator to calculate price trend indicator.
- Combine price trend indicator with bi-directional moving averages to get overall trend judgment.
- Go long when open price moving average crosses above close price moving average; close position when cross below.
- Only go long when trend indicator also indicates an uptrend; only go short when trend indicator indicates a downtrend.
Advantages
- Bi-directional moving averages trace trends more smoothly and steadily.
- Trend indicator helps better determine trend direction and avoid wrong trades.
- Crossovers provide clearer trading signals.
- Customizable smoothness through parameter tuning to suit more market environments.
- Multiple cross validations between indicators help avoid false signals.
Risks
- Risk of missing reversal at trend turning points. Can be mitigated by tuning moving average periods.
- Moving averages themselves have lag. Need validation from trend indicator.
- Improper moving average periods may lead to overtrading or missing good entries.
- Extensive parameter optimization is needed to adapt to different timeframes and markets.
Improvements
- Test more types of moving averages.
- Try other types of trend indicators.
- Optimize parameters of moving averages and trend indicators.
- Incorporate other indicators like volatility.
- Add stop loss strategies.
Conclusion
With parameter tuning, this multi-dimensional trend strategy can steadily track long-term trends with relatively low risk. But be cautious of overfitting. Overall it delivers long-term trend tracking with controllable risks and is worth further research and application.
Source
Pine
Strategy parameters
Related strategies
Comment
All comments (0)
No data
- 1