Trend Tracking Moving Average RSI Strategy

Overview
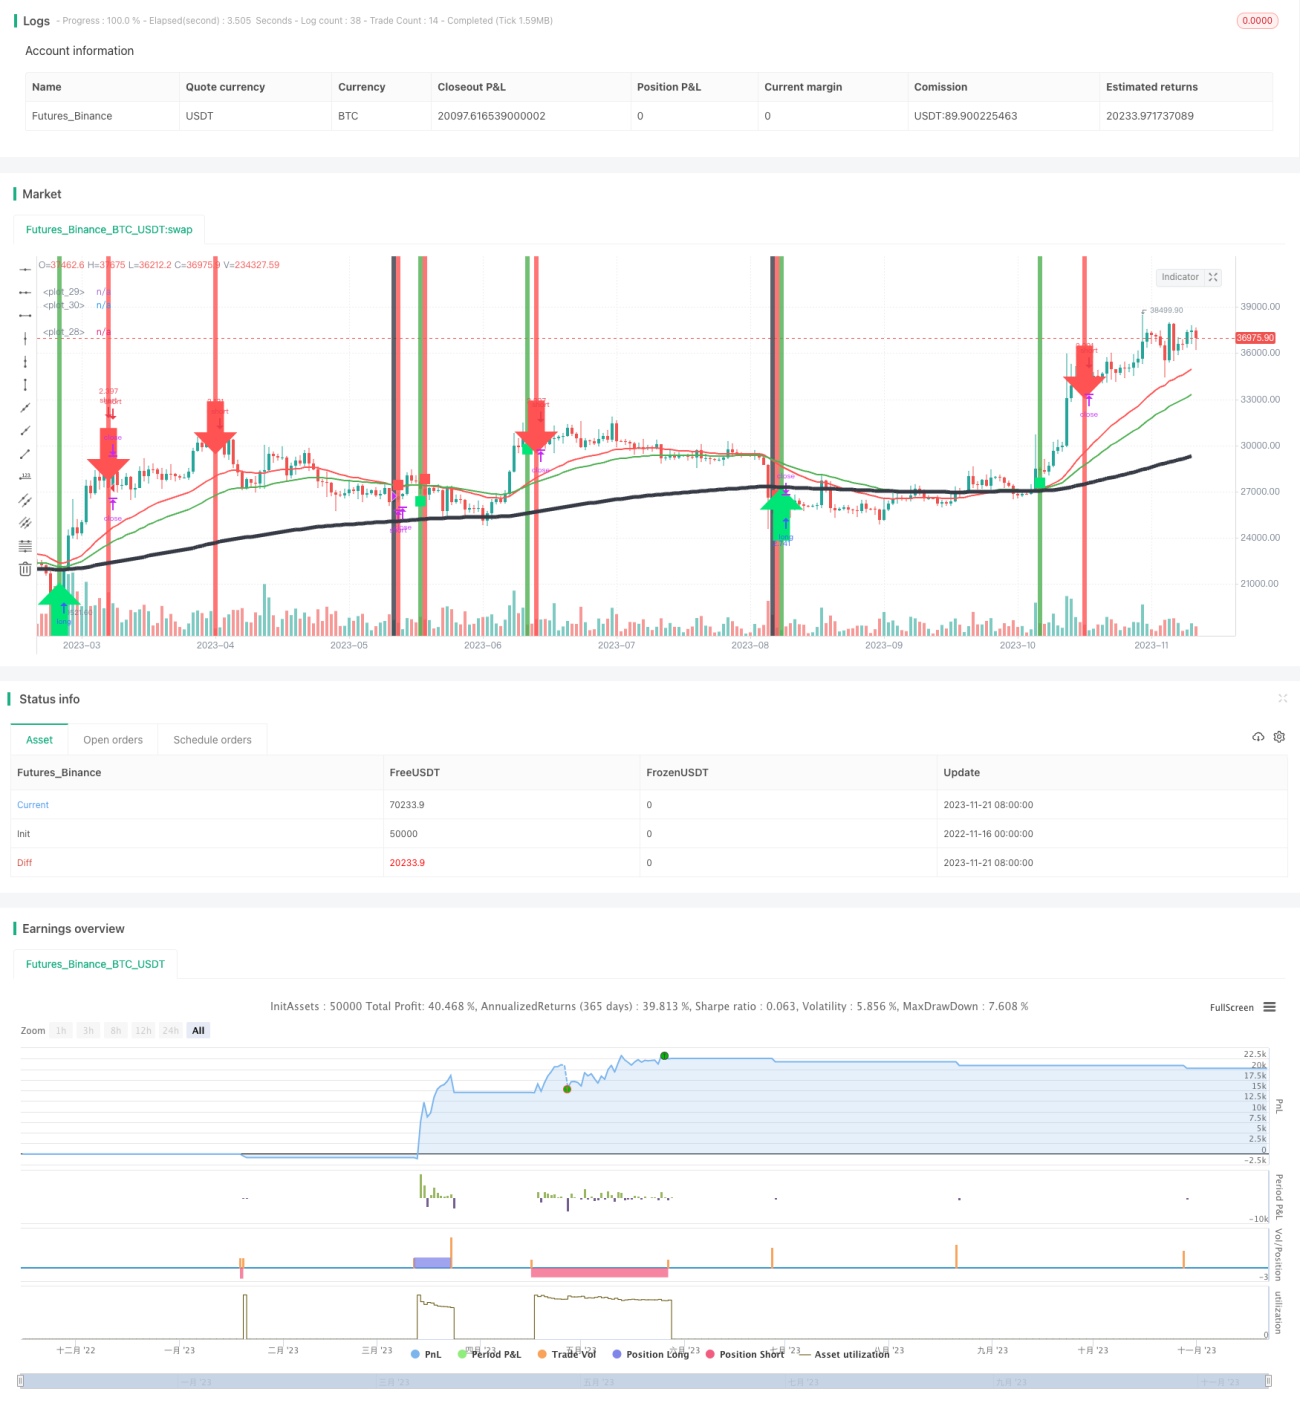
The Trend Tracking Moving Average RSI strategy is an automated stock trading strategy that utilizes both trend analysis and overbought-oversold indicators. The strategy employs simple moving averages to determine market trend direction and combines Relative Strength Index (RSI) indicators to generate trading signals, realizing trend judgment and tracking.
Strategy Logic
The strategy consists of three main parts:
-
Trend judgment: Calculates the long-term trend with 200-day simple moving average, and the short-term trend with 30-day and 50-day simple moving averages. When the short-term moving average crosses over the long-term one, it is a bullish signal, and when it crosses below, it's a bearish signal, to determine long-term and short-term market trends.
-
Overbought-Oversold Analysis: Calculates the 14-day RSI indicator. RSI above 80 is the overbought zone and below 20 is the oversold zone. Trading signals are generated when the RSI indicator drops from the overbought zone or rises from the oversold zone.
-
Entry and Exit: When overbought or oversold signals are identified, if the direction is consistent with the trend analysis, long/short positions will be opened. When short-term and long-term moving averages have golden crosses, it is judged that trends are reversing and existing positions will be closed.
With this strategy, it is possible to enter the market timely when prices reverse, while filtering out some noisy trades by incorporating trend analysis, with relatively excellent drawdown control.
Advantage Analysis
The strategy has the following advantages:
- Combining trend analysis and overbought-oversold indicators to filter out noise and identify turns in the market.
- Considering trends in both long-term and short-term timeframes for more accurate judgments.
- Using moving averages as stop loss methods so that stop loss points can be set based on market volatility.
- Strict entry conditions help avoid false breakouts effectively.
Risks and Solutions
There are also some risks with this strategy:
- Frequent insignificant trades may occur if the market stays range-bound for a prolonged time. Additional filters can be added to avoid unnecessary trades.
- There is some time lag risk. Shortening moving average cycle parameters can mitigate it.
- RSI signals can be influenced by stocks and markets. More factors like candlestick patterns should be combined to judge the effectiveness.
Optimization Directions
The strategy can be further optimized in the following aspects:
- Adding more filters like volume, candlestick patterns to further improve signal quality.
- Optimizing moving average and RSI cycle parameters to match different stock characteristics.
- Building dynamic moving averages to automatically adjust parameters based on market volatility and risk appetite.
- Using more advanced techniques like machine learning to determine market trends with higher accuracy.
Summary
In general, the Trend Tracking Moving Average RSI Strategy is a very practical strategy idea, filtering out market noise to some extent by combining trend analysis and overbought-oversold indicators, making trading signals more accurate and valid. As optimization tools and parameters continue to be enhanced, this strategy can become a steadily profitable long-term trading system.
- 1