T3-CCI Trend Tracking Strategy

Overview
This is a quantitative strategy that utilizes the T3 smoothed moving average line and CCI indicator to track trends. The strategy identifies trends by calculating the T3-CCI indicator and enters the market after obtaining double confirmation signals to follow trends.
Strategy Principle
The strategy first calculates the T3 smoothed moving average line and CCI indicator. It then converts the CCI indicator into the T3-CCI indicator through a series of filtering calculations. It generates a buy signal when the T3-CCI indicator crosses above the 0 axis and a sell signal when crossing below the 0 axis. To filter out false signals, the strategy requires the T3-CCI indicator to maintain the same signal for two consecutive periods before placing an order.
Specifically, the strategy takes the following steps:
- Calculate the CCI indicator and T3 indicator
- Convert the CCI indicator into the T3-CCI indicator through a series of digital filters
- Judge the long/short state of the T3-CCI indicator
- Wait for persistent signals over two bars as entry signals
Advantage Analysis
The strategy has the following advantages:
- Effectively smooths the CCI indicator using the T3 indicator to filter out market noise
- Adopts a double confirmation mechanism to avoid false signals
- Tracks medium-to-long-term trends and avoids short-term pullbacks
Risk Analysis
The strategy also has some risks:
- It is prone to generating false signals in range-bound markets
- The double confirmation mechanism may miss short-term opportunities
- High risk of stop loss in major trend reversals
Countermeasures:
- Adjust CCI and T3 parameters to optimize indicator performance
- Appropriately shorten confirmation periods or run fast/slow parameter combinations simultaneously
- Adopt moving stop loss or timely stop loss to control single transaction loss
Optimization Directions
The strategy can be optimized in the following directions:
- Adjust CCI and T3 parameters to suit different cycles and markets
- Increase trend judgment indicators to improve signal quality
- Automatically adjust stop loss position based on volatility
- Dynamically optimize parameters using machine learning methods
Summary
Overall, this is a reliable medium-to-long-term trend tracking strategy. It controls risks with double confirmation and trend tracking features, and can serve as a basic trend trading strategy. Further performance improvement can be achieved through parameter and rule optimization.
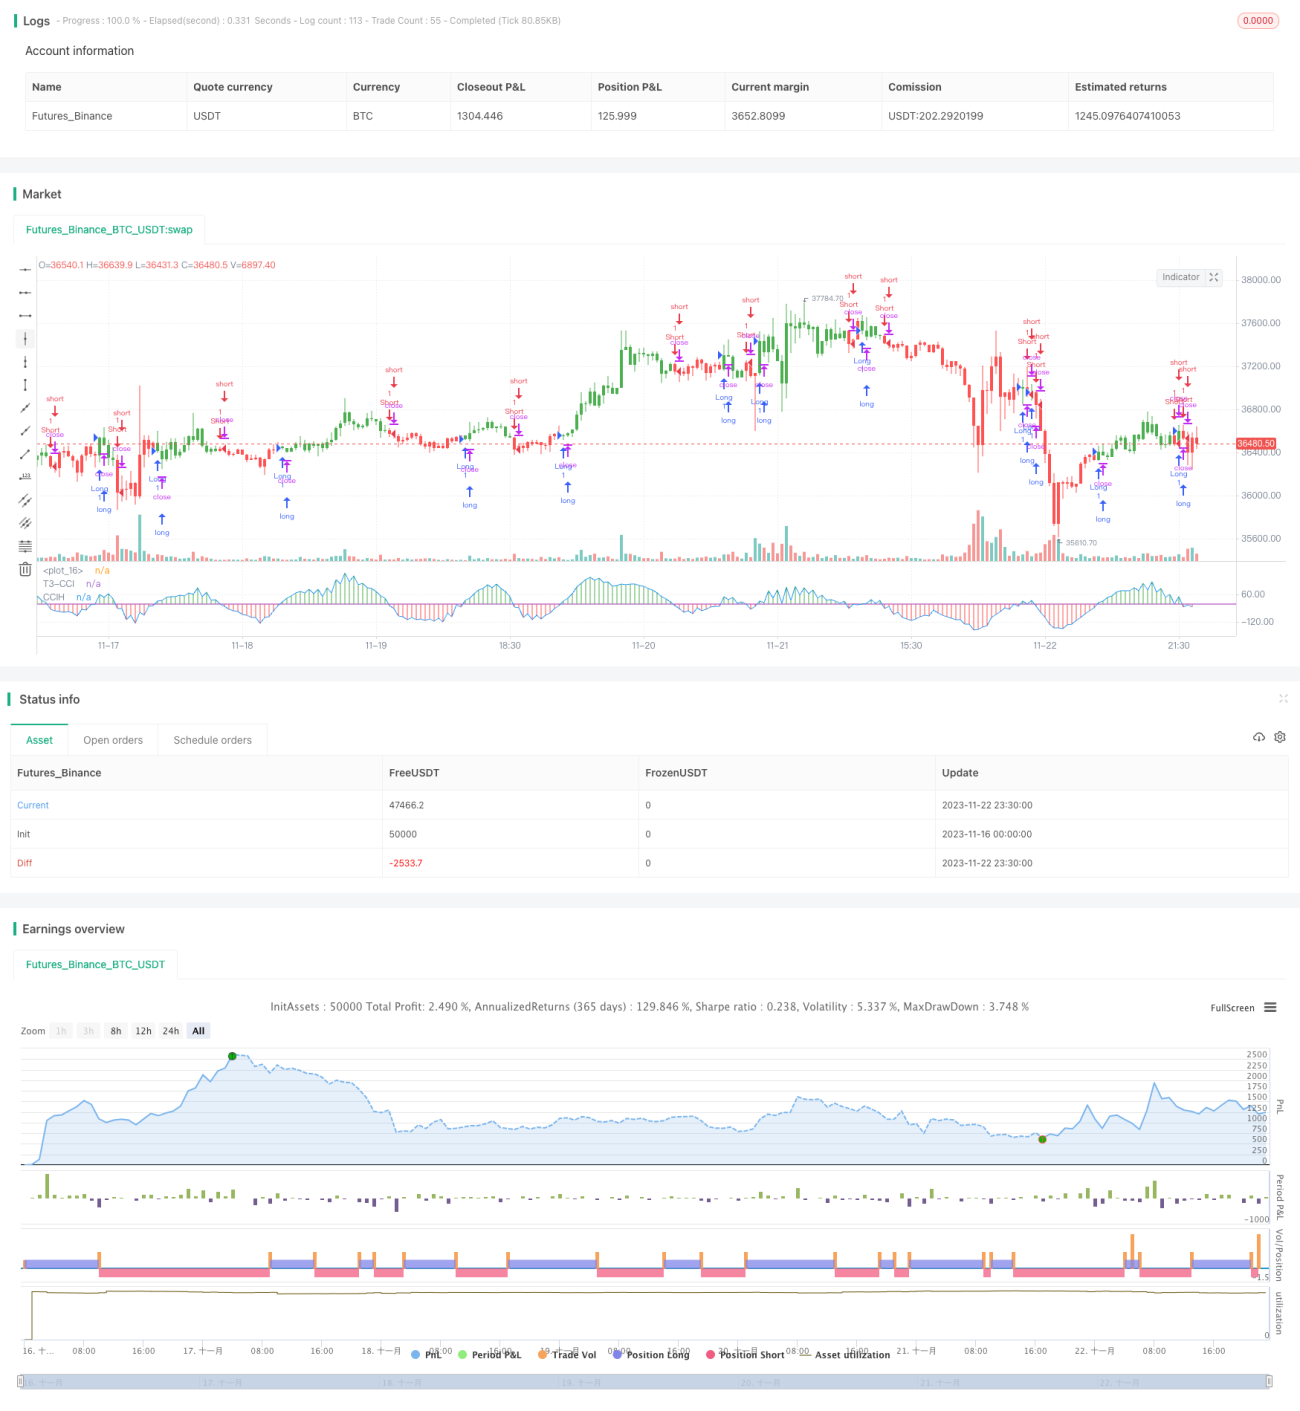
/*backtest
start: 2023-11-16 00:00:00
end: 2023-11-23 00:00:00
period: 30m
basePeriod: 15m
exchanges: [{"eid":"Futures_Binance","currency":"BTC_USDT"}]
*/

//@version = 2
////////////////////////////////////////////////////////////
//  Copyright by HPotter v1.0 19/12/2016
// This simple indicator gives you a lot of useful information - when to enter, when to exit- 1