概述
该策略是基于CCI指标的趋势跟踪策略。它使用两个不同周期的CCI指标进行交易信号生成。具体来说,它会监测一个较短周期的CCI指标是否突破一个较长周期的CCI指标,根据突破的方向来决定做多或做空。
策略原理
该策略的核心逻辑是:
- 定义两个CCI指标,ci1为14周期,ci2为56周期
- 当ci1向上突破ci2时,做多
- 当ci1向下突破ci2时,做空
- 交易信号发出后,通过ci1和ci2的数值来决定持仓的平仓
做多的具体规则是:
- ci1上穿ci2,即短周期CCI上穿长周期CCI
- 止损条件:ci1<-50且变化率或ci1跌破-100
做空的具体规则是:
- ci1下穿ci2,即短周期CCI下穿长周期CCI
- 止损条件:ci1>100且变化率>0或ci2上穿100
可以看出,该策略利用较短周期CCI的敏感性以及较长周期CCI的稳定性,实现了趋势的识别和跟踪。
策略优势
该策略具有以下优势:
- 利用CCI指标的优势,能够有效识别趋势
- 双CCI设计可以过滤掉部分噪音交易
- 通过长短周期CCI指标的组合,可以在跟踪趋势的同时控制风险
- 策略规则简单清晰,容易理解和实现
- 可配置性较强,CCI周期和止损条件都可以自定义
策略风险
该策略也存在一些风险:
- CCI指标对于横盘和震荡行情识别能力较弱
- 长短周期CCI可能发生背离,导致交易信号错误
- 止损条件设置不当可能造成较大亏损
- 参数设置不当也会对策略收益产生较大影响
对应风险的解决方法:
- 可以结合其他指标来判断行情,避免在震荡行情中交易
- 增加过滤条件,避免长短周期CCI背离带来的错误信号
- 优化和测试不同的止损条件
- 通过回测和参数优化选择合适的参数组合
策略优化方向
该策略还可以进一步优化的地方包括:
- 增加其他指标判断,形成更 SYSTEM 的交易系统
- 测试不同weekday和session的收益差异
- 结合 machine learning 方法寻找更优的参数
- 根据不同品种特性调整参数
- 优化开仓和平仓条件
总结
本策略整体来说是一个基于长短周期CCI指标突破的简单趋势跟踪策略。它能够有效识别趋势方向并跟踪趋势。同时通过止损等手段控制风险。本策略简单实用,参数调整灵活,可作为量化交易的入门策略。通过进一步优化和组合,可以形成更强大的交易系统。
策略源码
/*backtest
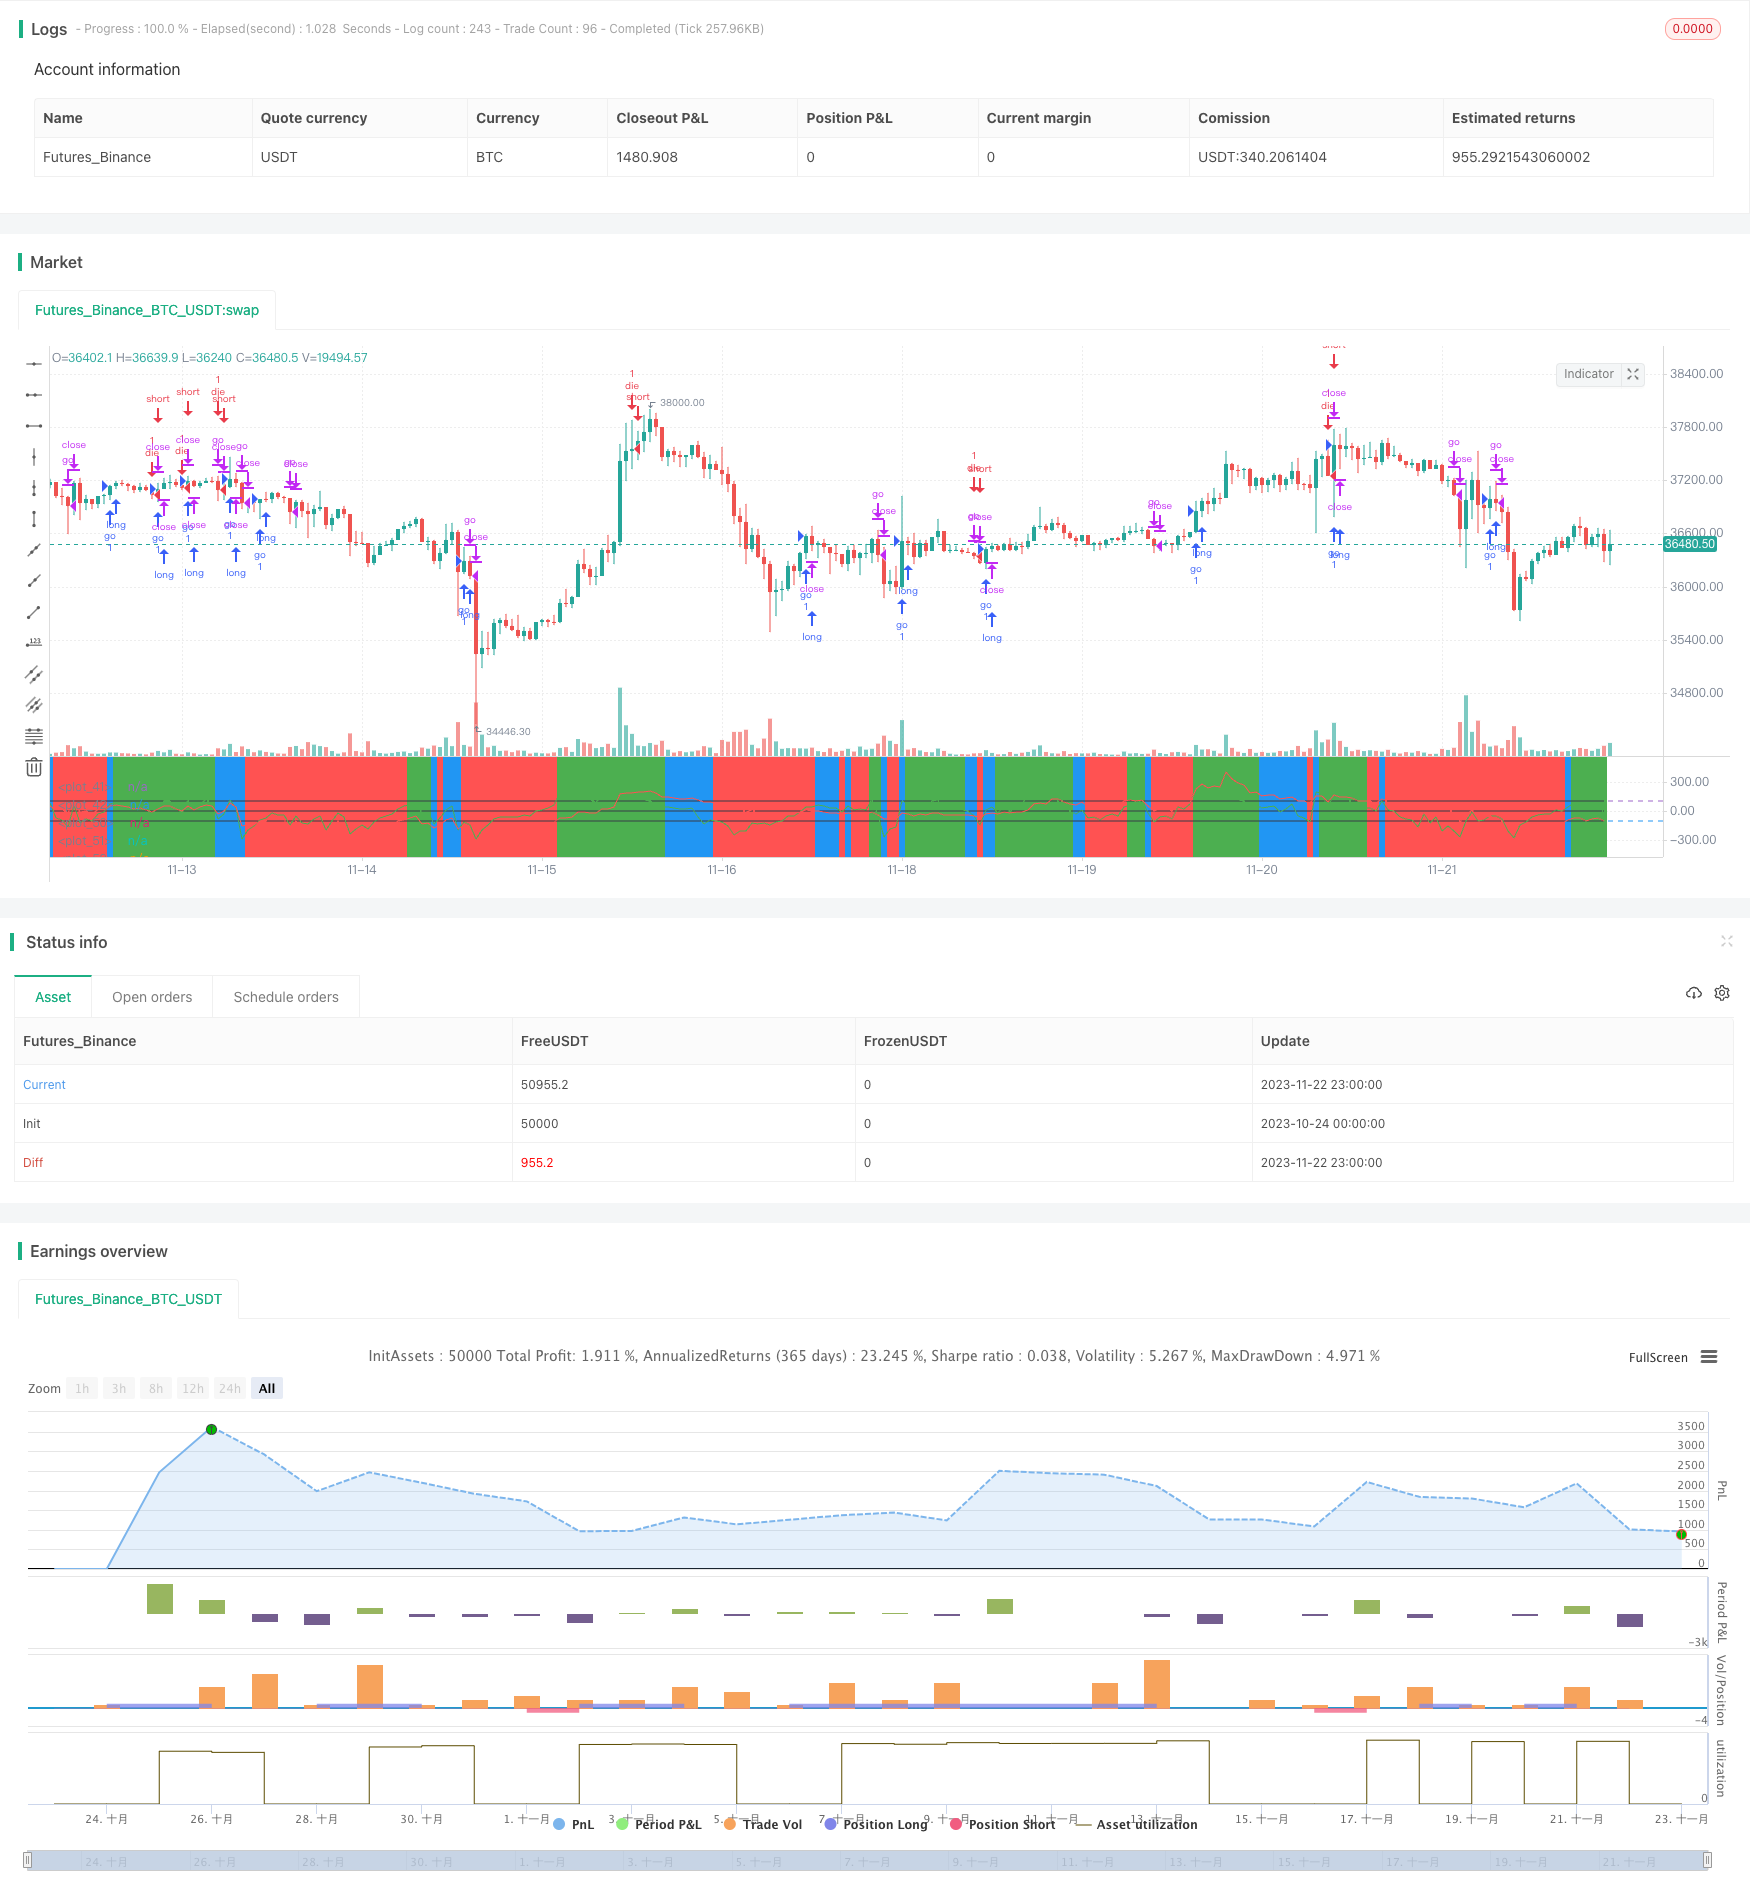
start: 2023-10-24 00:00:00
end: 2023-11-23 00:00:00
period: 1h
basePeriod: 15m
exchanges: [{"eid":"Futures_Binance","currency":"BTC_USDT"}]
*/
//@version=3
strategy(title="my work",calc_on_order_fills=true,currency=currency.USD, default_qty_type=strategy.percent_of_equity,commission_type=strategy.commission.percent)
source = close
shortlength=input(14)
longlength=input(56)
aa=input(2)
Ss=input(75)
//Cci part
ci1=cci(source,shortlength) //4시간봉의 기본 cci
ci2=cci(source,longlength) //4시간봉에서 12시봉의 cci 무빙측정
//오린간 선생님의 WT + ichimoku
len = input(10)
lenTurn = input(9)
lenStd = input(26)
wtm_e(so, l) =>
esa = ema(so, l)
d = ema(abs(so - esa), l)
ci = (so - esa) / (0.015 * d)
ema(ci, l*2+1)
alh(len) => avg(lowest(len), highest(len))
alh_src(src, len) => avg(lowest(src, len), highest(src, len))
wt = wtm_e(close,len)
turn = alh_src(wt, lenTurn)
std = alh_src(wt, lenStd)
cnt = 0
if wt > turn
cnt:=cnt+1
if wt > std
cnt:=cnt+1
//100,-100선
h0 = hline(100)
h1 = hline(-100)
//plot(ci,color=green)
// plot(k,color=green)
// plot(d,color=red)
plot(ci1,color=green)
plot(ci2,color=red)
plot(0,color=black)
plot(100,color=black)
plot(-100,color=black)
fill(h0,h1,color=purple,transp=95)
bgcolor(cnt==0 ? red : cnt==1 ? blue : cnt == 2 ? green : na, transp = Ss)
//기간조정
Fromday = input(defval=1, title="from day", minval=1, maxval=31)
FromMonth = input(defval=1, title="from month", minval=1, maxval=12)
FromYr = input(defval=2019, title="from yr", minval=1970)
Today = input(defval=13, title="to day", minval=1, maxval=31)
ToMonth = input(defval=12, title="to month", minval=1, maxval=12)
ToYr = input(defval=2019, title="to yr", minval=1970)
startDate = timestamp(FromYr, FromMonth, Fromday, 00, 00)
finishDate = timestamp(ToYr, ToMonth, Today, 00, 00)
Time_cond = true
/////롱
if crossover(ci1,ci2) and change(ci2)>0 and Time_cond
strategy.entry("go", strategy.long, comment="go")
strategy.close("go", (ci2<0 and ci1 <-50 and change(ci1)<0) or (crossunder(ci1,-100) and strategy.openprofit<0) and change(cnt)<0)
/////숏
if (crossunder(ci1,ci2) and change(ci2)<0 and falling(ci1,aa)) and Time_cond
strategy.entry("die", strategy.short, comment="die")
strategy.close("die", (ci2>0 and ci1 > 100 and change(ci1)>0) or (crossover(ci2,100) and strategy.openprofit<0) and change(cnt)>0)