概述
该策略是一种多时间框架的量价指标交易策略。它综合运用了相对强弱指数(RSI)、平均真实波幅(ATR)、简单移动平均线(SMA)以及自定义的量价条件来识别潜在的做多信号。当满足一定的超卖、量价指标交叉、价格突破等条件时,该策略会建立做多头寸。同时,它也设置了止损位和止盈位来控制每单的风险收益比。
策略原理
该策略主要基于以下几个关键点:
- RSI低于超卖线且在最近10根K线内连续处于超卖状态时,视为超卖信号
- 定义了多组量价条件,需要同时满足这些量价条件才认为量价指标发出做多信号
- 当收盘价从下向上突破13周期的SMA时,视为价格的突破信号
- ATR小周期低于大周期也是助推信号
- 综合上述多个指标信号,形成最终做多决策
具体来说,该策略对RSI指标设置了长度和超卖线参数,根据这些参数计算RSI值。当RSI指标连续多根K线低于超卖线时,产生超卖信号。
此外,该策略定义了3个交易量阈值,根据不同时间周期的数据,设定了多组量价条件。例如90周期的量值大于49周期量值的1.5倍。当这些量价条件同时满足时,发出量价指标的做多信号。
在价格方面,该策略计算13周期SMA指标,并统计价格向上突破SMA以来的K线数量。当价格从下向上突破SMA,且突破后的K线数量少于5根时,视为价格的突破信号。
ATR周期参数方面,该策略指定了小周期5和大周期14的ATR。当小周期ATR低于大周期ATR时,表示市场波动加速缩小,作为助推的做多信号。
最终,该策略综合考虑上述多个买入条件,包括超卖、量价指标、价格突破和ATR指标。当这些条件同时满足时,产生最终的做多信号,并建立做多头寸。
策略优势
该策略具有以下几个优势:
多时间框架量价指标判断,提高精确度。策略不仅考虑单一周期的量价数据,而是评估多组不同周期量价条件的交叉情况,可以更精确判断量能的集中度。
超卖+量价+价格三重判断机制,确保买入信号的可靠性。超卖提供了最基础的买入时点选取,此外量价和价格的指标交叉为买入时机增加了额外确认,可靠性较高。
设置止损止盈机制严格控制单笔交易风险。止损和止盈参数可以根据个人风险偏好进行调整,在追求利润最大化的同时合理控制每单的风险。
多指标集成判断增加弹性。即使部分指标发生故障或错误,仍能依靠其他指标判断保证一定的持续运作能力。
风险及对策
该策略也存在一些风险:
参数配置风险。各类指标的参数设置直接影响判断结果,不合理的参数可能导致交易信号产生偏差。需认真求证参数的合理取值。
盈利空间有限。作为融合多个指标进行集成判断的策略,信号产生频率相对更为保守,单位时间内交易次数较少,盈利空间存在一定局限。
指标发散风险。当部分指标发出做多信号而另一些指标发出做空信号时,策略无法确定最优决策。这需要提前识别并解决指标间可能的发散情况。
策略优化方向
该策略可以进一步从以下几个方面进行优化:
增加机器学习模型辅助判断。可以训练量价及波动特征模型,辅助人工设定的参数,实现参数的动态化。
提高止盈策略的成熟度。例如可以设置浮动止盈、分批止盈、跟踪止盈等,在防止掉期的同时可以进一步提升每单收益。
评估引入盘口数据。除K线量价数据外,结合深度买卖盘口数据也可以判断持仓分布情况,可提供额外参考信号。
测试校验其他指标集成。本策略主要运用RSI、ATR和SMA等指标进行集成,还可以尝试引入布林线、KDJ等其他指标组合,丰富和优化交易信号来源。
总结
本策略综合运用了RSI、ATR、SMA及自定义量价条件判断来实现对潜在做多时机的识别。它同时具有多时间框架量价指标判断、三重信号确认机制及止损止盈控制风险等优势。当然也需要留意参数配置风险、盈利空间限制等问题。未来该策略可以从机器学习辅助、止盈策略优化、盘口数据引入及指标集成扩展等方面进行进一步优化。
/*backtest
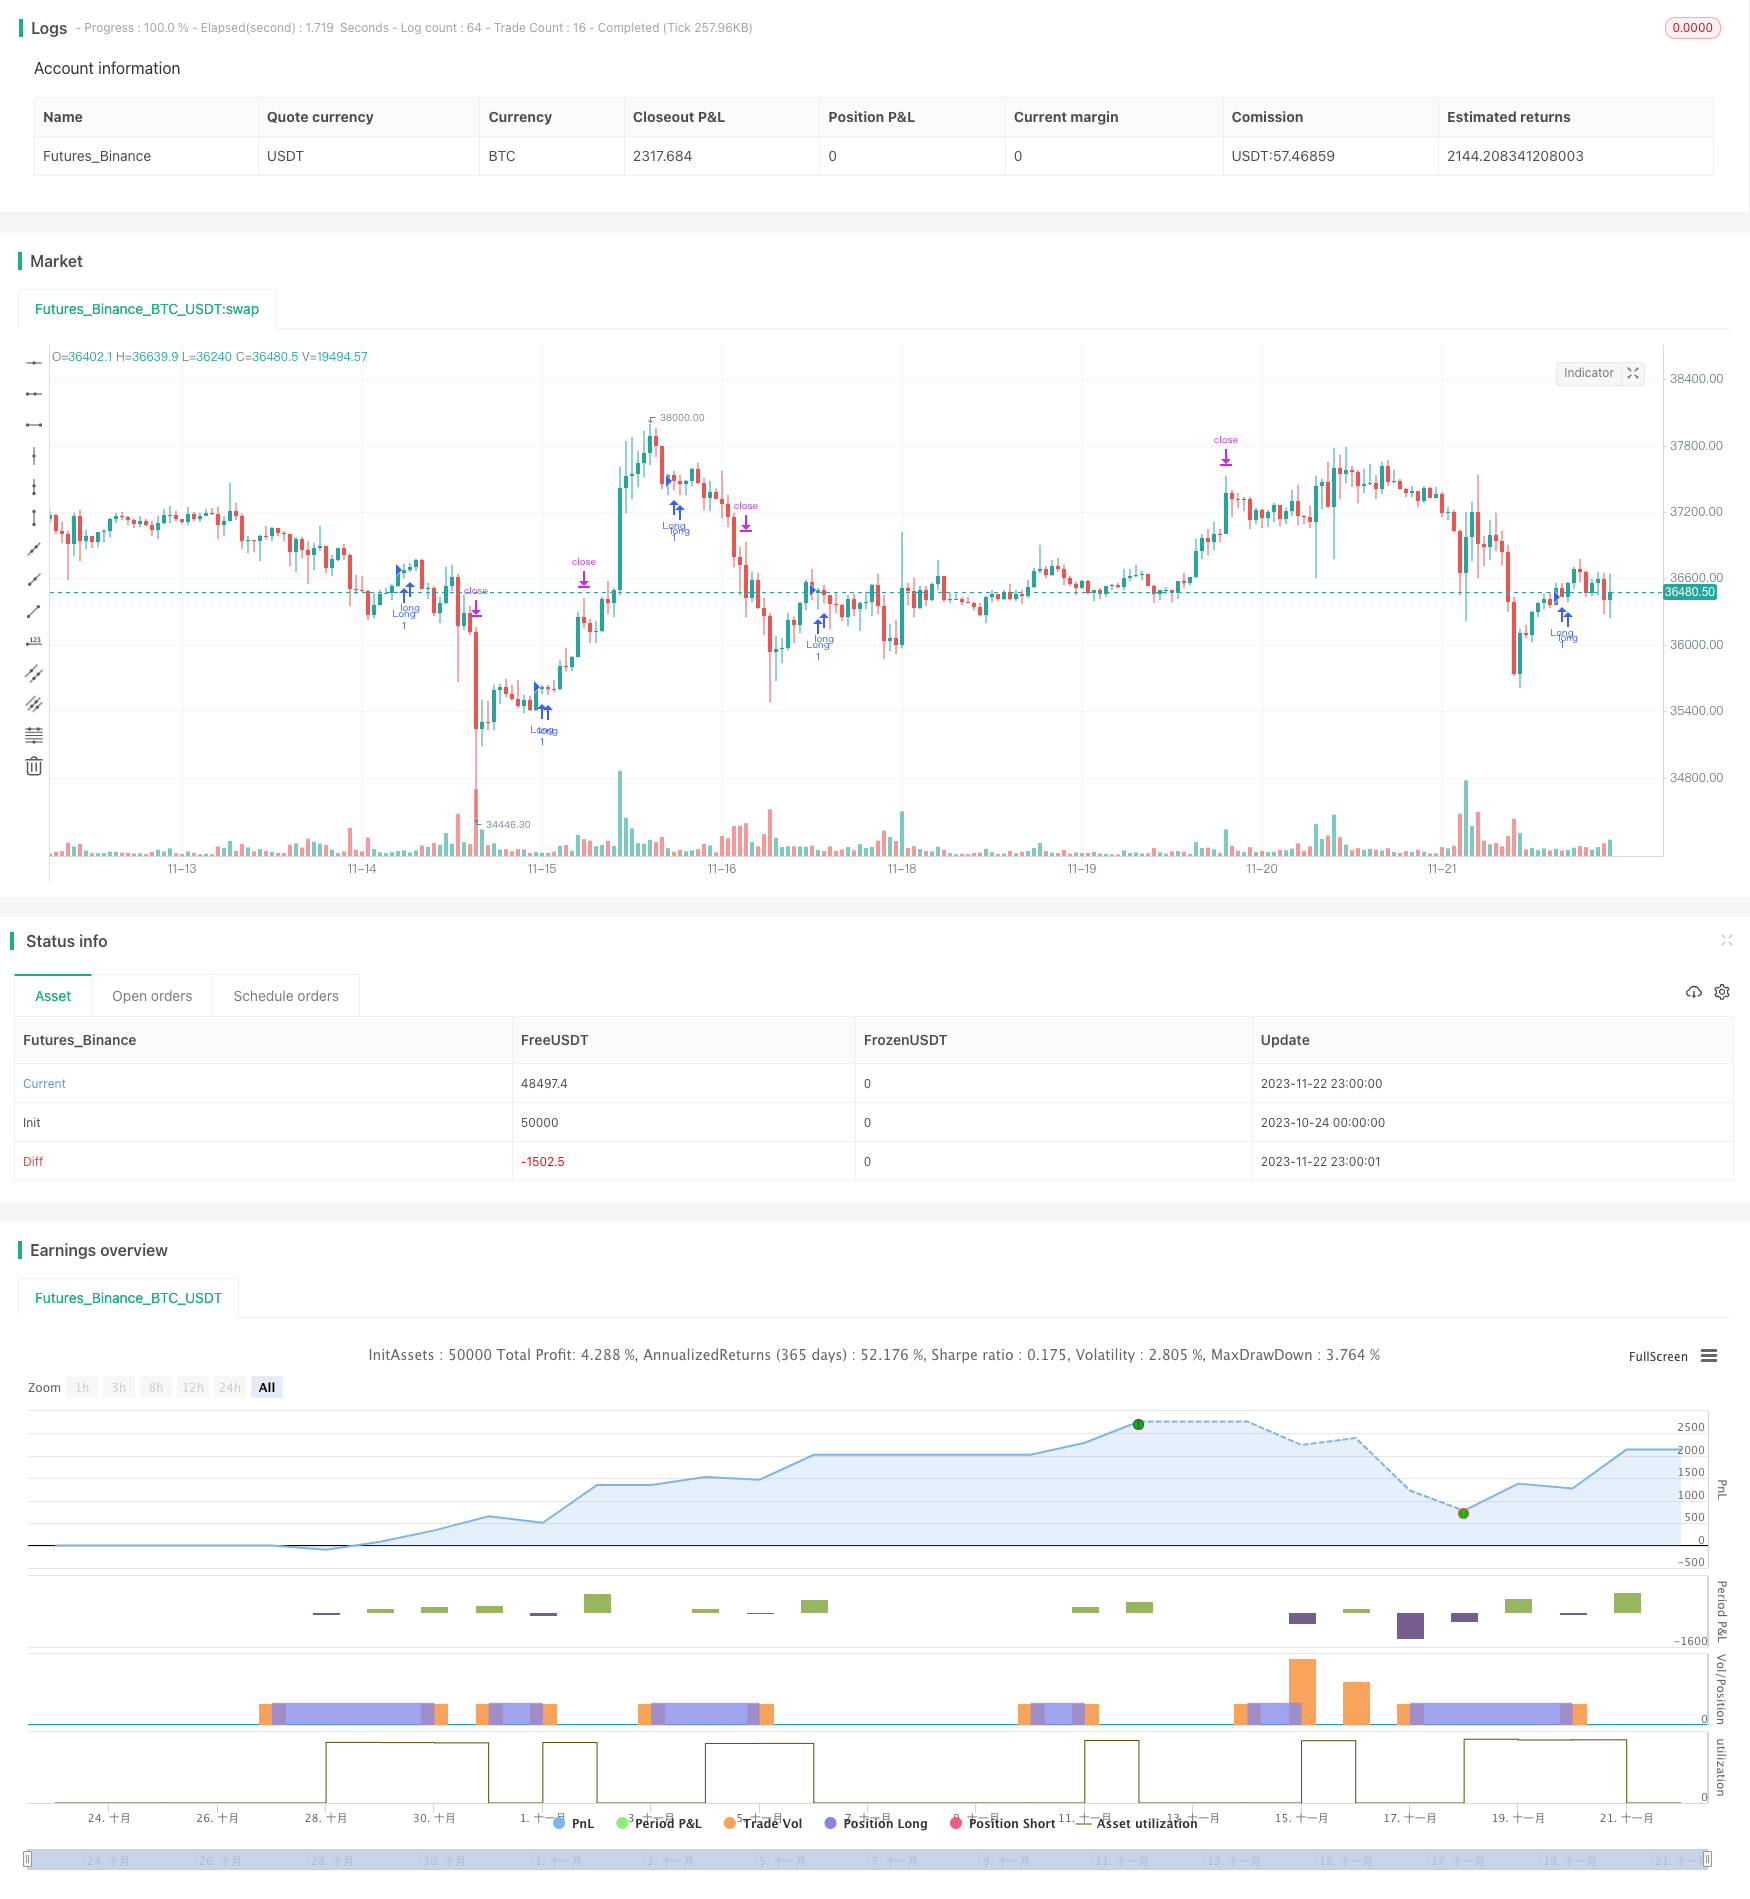
start: 2023-10-24 00:00:00
end: 2023-11-23 00:00:00
period: 1h
basePeriod: 15m
exchanges: [{"eid":"Futures_Binance","currency":"BTC_USDT"}]
*/
// © Kimply_Tr
//@version=5
// Strategy settings and parameters
strategy(title='Volume ValueWhen Velocity', overlay=true)
// Define the stop-loss and take-profit percentages for the long strategy
long_stoploss_value = input.float(defval=3, title='Stop-Loss (SL) %', minval=0, group='▶ Stop Loss/Take Profit => Long-Strategy', inline='2')
long_stoploss_percentage = close * (long_stoploss_value / 100) / syminfo.mintick // Calculate long stop-loss percentage
long_takeprofit_value = input.float(defval=2, title='Take-Profit (TP) %', minval=0, group='▶ Stop Loss/Take Profit => Long-Strategy', inline='2')
long_takeprofit_percentage = close * (long_takeprofit_value / 100) / syminfo.mintick // Calculate long take-profit percentage
// Define parameters related to ValueWhen occurrences
occurrence_ValueWhen_1 = input.int(title='occurrence_ValueWhen_1', defval=1, maxval=100, step=1, group="▶ ValueWhen",tooltip ="Its value must be smaller than (occurrence_ValueWhen_2)")
occurrence_ValueWhen_2 = input.int(title='occurrence_ValueWhen_2', defval=5, maxval=100, step=1, group="▶ ValueWhen" ,tooltip="Its value must be greater than (occurrence_ValueWhen_1)")
distance_value=input.int(title='distance_value_occurrence', defval=170, maxval=5000, step=1, group="▶ ValueWhen" ,tooltip="It indicates the minimum distance between the occurrences of 1 and 2, i.e. the difference between the occurrences of 1 and 2 is greater than (distance_value_occurrence)")
// Define RSI-related parameters
rsi_over_sold = input.int(defval=60, minval=1, title='Oversold Level', group='▶ RSI',inline ='2') // Input for oversold level in RSI
rsi_length = input.int(defval=40, minval=1, title='RSI Length', group='▶ RSI',inline ='2') // Input for RSI length
rsi = ta.rsi(close, rsi_length) // Calculate RSI
// Define volume thresholds
volume_threshold1 = input.float(title='volume_threshold_1', defval=0.5, maxval=10, step=0.1, group="▶ Volume")
volume_threshold2 = input.float(title='volume_threshold_2', defval=0.4, maxval=10, step=0.1, group="▶ Volume")
volume_threshold3 = input.float(title='volume_threshold_3', defval=0.62, maxval=10, step=0.1, group="▶ Volume")
// ATR (Average True Range)
// Define ATR parameters
atr_small = input.int(title='ATR_Small', defval=5, maxval=500, step=1, group="▶ Atr",inline ='2')
atr_big = input.int(title='ATR_Big ', defval=14, maxval=500, step=1, group="▶ Atr",inline ='2')
atr_value3 = ta.atr(15) // Calculate ATR value 3
////////////////////////////////////////////////////////////////////////////////////////////////////////////////////////
// Date Range
// Define the date range for back-testing
start_date = input.int(title='Start Day', defval=1, minval=1, maxval=31, group='▶ Time-Period for Back-Testing', inline='1') // Input for start day
end_date = input.int(title='until Day', defval=1, minval=1, maxval=31, group='▶ Time-Period for Back-Testing', inline='1') // Input for end day
start_month = input.int(title='Start Month', defval=7, minval=1, maxval=12, group='▶ Time-Period for Back-Testing', inline='2') // Input for start month
end_month = input.int(title='until Month', defval=1, minval=1, maxval=12, group='▶ Time-Period for Back-Testing', inline='2') // Input for end month
start_year = input.int(title='Start Year', defval=2022, minval=1800, maxval=3000, group='▶ Time-Period for Back-Testing', inline='3') // Input for start year
end_year = input.int(title='until Year', defval=2077, minval=1800, maxval=3000, group='▶ Time-Period for Back-Testing', inline='3') // Input for end year
in_date_range = time >= timestamp(syminfo.timezone, start_year, start_month, start_date, 0, 0) and time < timestamp(syminfo.timezone, end_year, end_month, end_date, 0, 0) // Check if the current time is within the specified date range
////////////////////////////////////////////////////////////////////////////////////////////////////////////////////////
was_over_sold = ta.barssince(rsi <= rsi_over_sold) <= 10 // Check if RSI was oversold in the last 10 bars
////////////////////////////////////////////////////////////////////////////////////////////////////////////////////////
getVolume(symbol, bar) =>
request.security(syminfo.tickerid, "D", volume)[bar] // Function to get volume data for a specific symbol and bar
getVolume2(symbol, bar) =>
request.security(syminfo.tickerid, "39", volume)[bar] // Function to get volume data for a specific symbol and bar 2
////////////////////////////////////////////////////////////////////////////////////////////////////////////////////////
firstCandleColor1 = request.security(syminfo.tickerid, "D", close[2] > open[1] ? 1 : 0)
firstCandleColor2 = request.security(syminfo.tickerid, "1", close[2] > open[0] ? 1 : 0)
firstCandleColor3 = request.security(syminfo.tickerid, "W", close[1] > open[1] ? 1 : 0)
firstCandleColor= ((firstCandleColor1+firstCandleColor2)) > firstCandleColor3 ? 1 : 0
////////////////////////////////////////////////////////////////////////////////////////////////////////////////////////
sma = ta.sma(close, 13) // Calculate the simple moving average (SMA) of the close price over 13 periods
numCandles = ta.barssince(close > sma) // Count the number of candles since the close price crossed above the SMA
atr1=request.security(syminfo.tickerid, "30", ta.atr(atr_small)<ta.atr(atr_big)) // Get the ATR value for the specific security and timeframe (30 minutes) and check if ATR_small is less than ATR_big
prevClose = ta.valuewhen(close > sma, close, occurrence_ValueWhen_1) // Get the close price when it first crosses above the SMA based on occurrence_ValueWhen_1
prevCloseBarsAgo = ta.valuewhen(close > sma, close, occurrence_ValueWhen_2) // Get the close price when it first crosses above the SMA based on occurrence_ValueWhen_2
prevCloseChange = (prevCloseBarsAgo - prevClose ) // Calculate the change in the close price between the occurrences of crossing above the SMA
atrval=(atr_value3>140) or (atr_value3 < 123) // Check if atr_value3 is either greater than 140 or less than 123
Condition = getVolume(syminfo.tickerid, 90) > volume_threshold1 * getVolume(syminfo.tickerid, 49) and getVolume(syminfo.tickerid, 110) > volume_threshold3 * getVolume(syminfo.tickerid, 49) and getVolume2(syminfo.tickerid, 30) > volume_threshold2 * getVolume2(syminfo.tickerid, 55) and getVolume2(syminfo.tickerid, 7) > volume_threshold2 * getVolume2(syminfo.tickerid, 3) // Check multiple volume conditions
buy_signal=Condition and atrval and firstCandleColor==0 and was_over_sold and prevCloseChange> distance_value and atr1 and numCandles<5 // Determine if the buy signal is generated based on various conditions
////////////////////////////////////////////////////////////////////////////////////////////////////////////////////////
// Long Strategy
// Enter long position if the buy signal conditions are met and within the specified date range
if buy_signal and in_date_range
strategy.entry('Long', strategy.long, alert_message='Open Long Position') // Enter long position
strategy.exit('Long SL/TP', from_entry='Long', loss=long_stoploss_percentage, profit=long_takeprofit_percentage, alert_message='Your SL/TP-Limit for the Long-Strategy has been activated.') // Exit long position with stop-loss and take-profit