MACD Trend Following Strategy

Overview
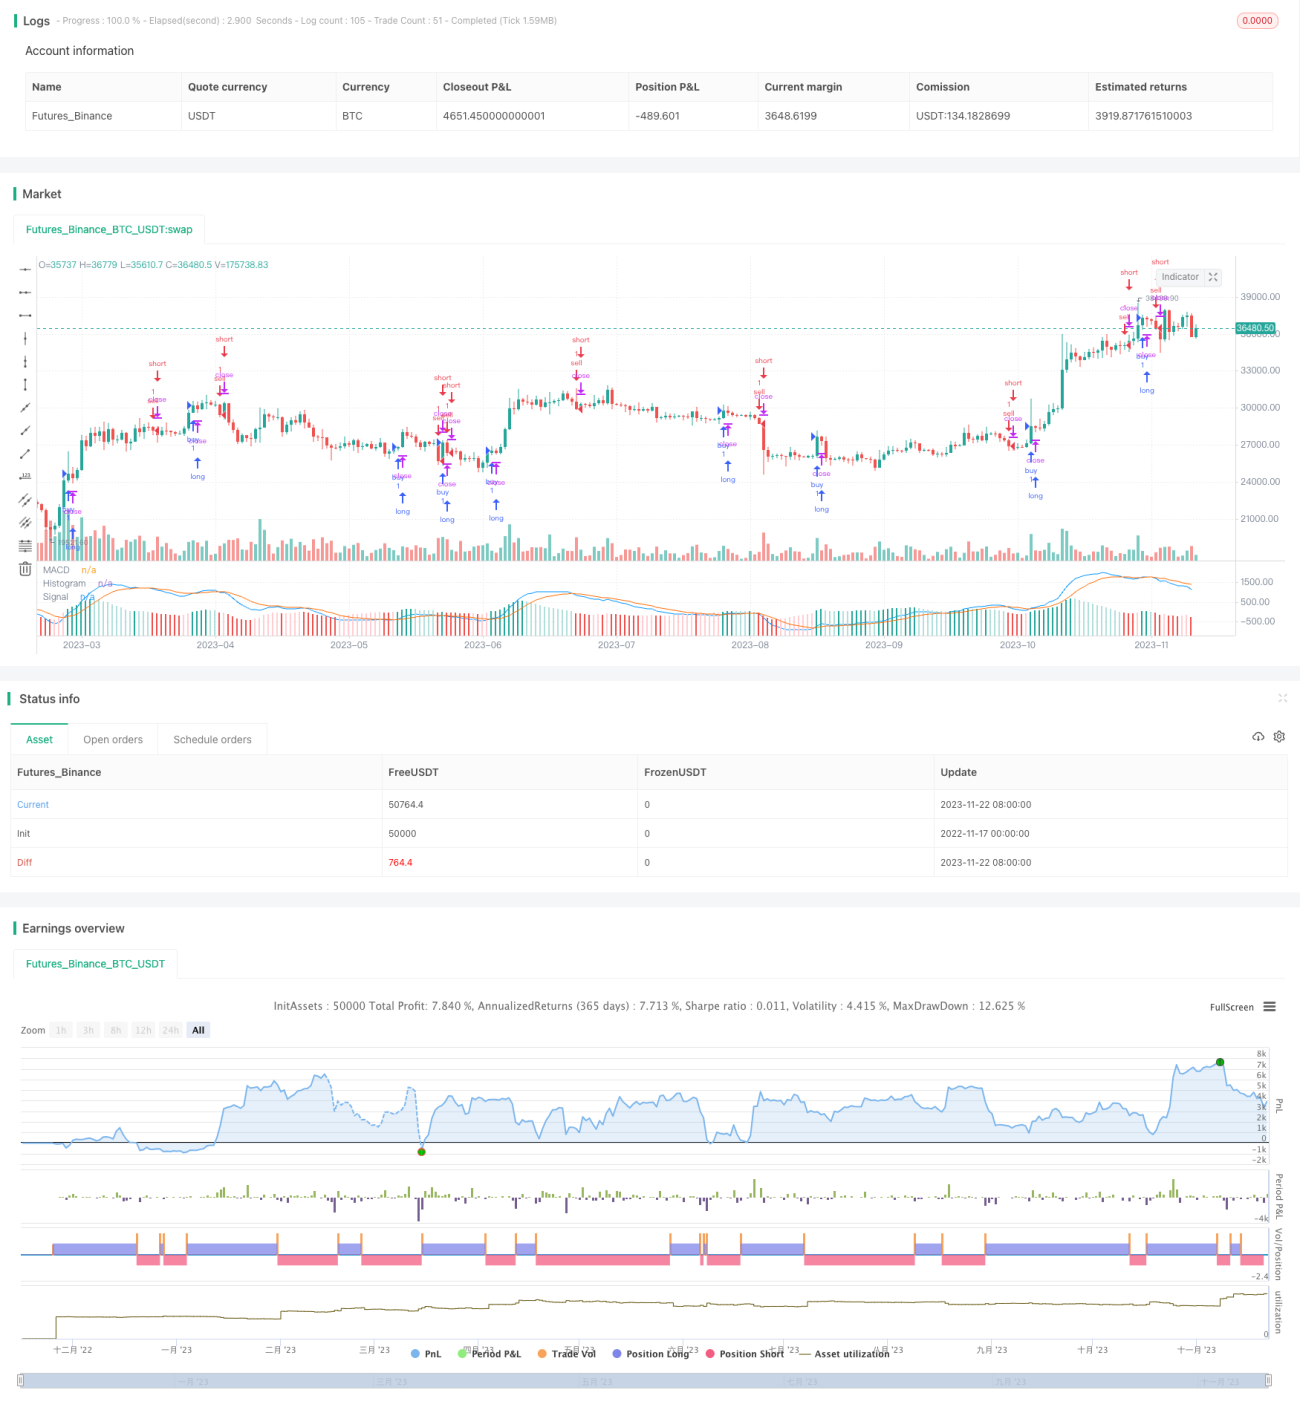
The MACD trend following strategy judges the trend by calculating the golden cross and dead cross of the MACD indicator and its signal line to follow the trend for profit.
Strategy Principle
This strategy is based on the MACD indicator to determine the trend direction. The MACD indicator is a trend-following momentum indicator, consisting of the MACD line, Signal line and Histogram. The golden cross of the MACD and Signal lines suggests a potential bull market, while the dead cross suggests a potential bear market. The Histogram represents the difference between the two lines, indicating their divergence and changing speed through color change.
When the Histogram rises from negative to positive, a golden cross signal is generated, indicating the uptrend may just begin, and long positions can be built. When the Histogram turns from positive to negative, a dead cross signal is generated, indicating the uptrend may be topping, and long positions can be exited or short positions can be built.
Advantage Analysis
- Utilize golden/dead cross of double smoothing lines to judge trend with relatively high win rate
- Histogram clearly indicates the progress and speed of MACD indicator
- Large parameter tuning space for optimization
- Can be combined with other indicators to filter fake signals
Risk and Optimization
- There is some degree of lagging
- May generate fake signals
- Try confirming trends with MA, KD etc.
- Adjust parameters for best configuration
Conclusion
The MACD trend following strategy overall is a relatively reliable way to determine trends. By optimizing parameters and confirming with other indicators, the fake signal rate can be largely reduced, resulting in higher strategy profit. The strategy logic is simple and easy to understand, making it the first choice for algorithmic trading starters.
- 1