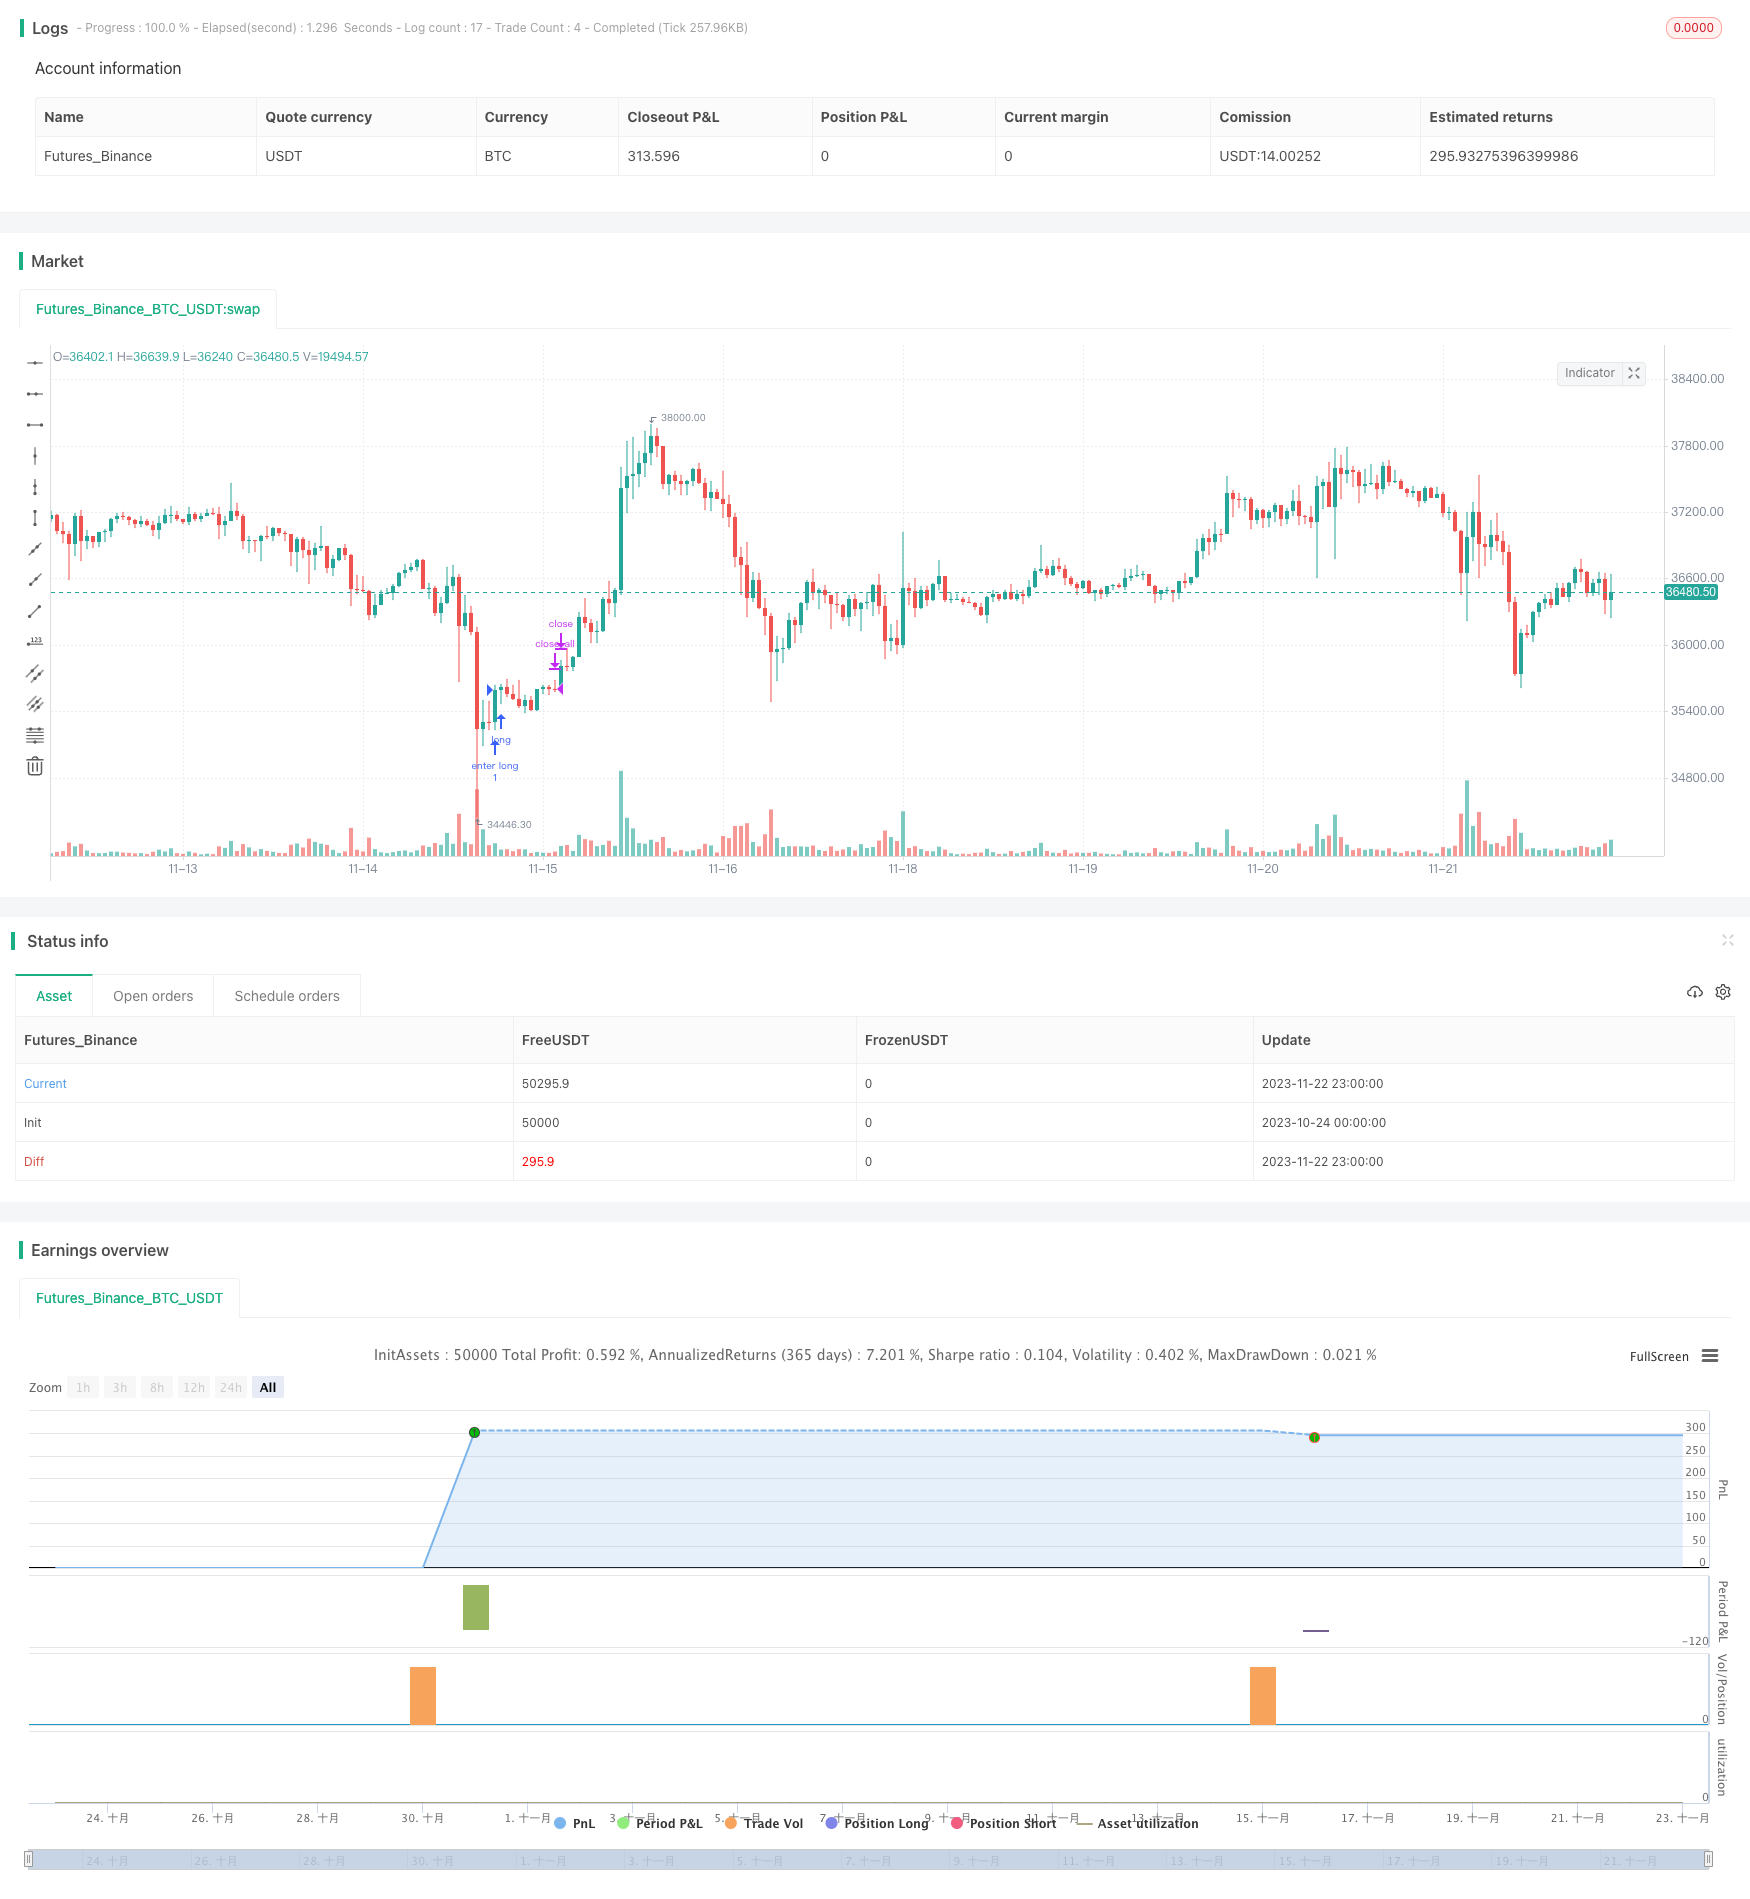
概述
反转捕捉策略是一个利用波动率指标布林线与动量指标RSI结合的反转交易策略。它设定了布林线通道和RSI的超买超卖线作为信号,在趋势方向转变的时候寻找反转机会进行交易。
策略原理
该策略使用布林线作为主要技术指标,辅以RSI等动量指标来验证交易信号。具体逻辑是:
- 判断大周期趋势方向,确定是看涨还是看跌。使用50日EMA与21日EMA的金叉死叉来判断。
- 在下跌趋势中,当价格上涨突破布林下轨,同时RSI指标刚刚从超卖区域反弹,出现金叉形态,说明超卖区域已经筑底,判断为买入信号。
- 在上涨趋势中,当价格下跌突破布林上轨,同时RSI指标刚刚从超买区域回落,出现死叉形态,说明超买区域已经开始回调,判断为卖出信号。
- 以上买入和卖出信号必须同时满足,避免假信号。
优势分析
该策略具有以下优势:
- 结合波动率指标和动量指标,信号较为可靠。
- 反转交易风险较小,适合短线操作。
- 程序化规则清晰,容易实现自动交易。
- 结合趋势交易,避免在震荡市场无序开仓。
风险分析
该策略也存在以下风险:
- 布林线通道突破假信号风险,需要RSI指标进行过滤。
- 反转失败的风险,需要及时止损。
- 反转时间点把握不准风险,可能出现提前入场或错过最佳点位。
针对以上风险,可以设置止损位置来控制风险敞口,同时优化参数,调整布林线周期或RSI参数。
优化方向
该策略主要可以从以下几个方向进行优化:
- 优化布林带参数,调整周期长度和标准差大小,寻找最佳参数组合。
- 优化移动平均线周期,确定趋势判断的最佳周期长度。
- 调整RSI参数,寻找最佳超买超卖区域范围。
- 增加其他指标结合,如KDJ、MACD等,丰富系统入场理由。
- 增加机器学习算法,利用AI技术自动寻找最佳参数。
总结
反转捕捉策略整体来说是一个效果较好的短线交易策略。它结合趋势判断和反转信号,既可过滤震荡市场的假信号,有避免在趋势市场与趋势的对冲,风险可控。通过不断优化参数和模型,可以获得更好的策略效果。
策略源码
/*backtest
start: 2023-10-24 00:00:00
end: 2023-11-23 00:00:00
period: 1h
basePeriod: 15m
exchanges: [{"eid":"Futures_Binance","currency":"BTC_USDT"}]
*/

// This is an Open source work. Please do acknowledge in case you want to reuse whole or part of this code.
// Please see the documentation to know the details about this.

//@version=5
strategy('Strategy:Reversal-Catcher', shorttitle="Reversal-Catcher", overlay=true , currency=currency.NONE, initial_capital=100000)

// Inputs
src = input(close, title="Source (close, high, low, open etc.")

BBlength = input.int(defval=20, minval=1,title="Bollinger Period Length, default 20")
BBmult = input.float(defval=1.5, minval=1.0, maxval=4, step=0.1, title="Bollinger Bands Standard Deviation, default is 1.5")

fastMovingAvg = input.int(defval=21, minval=5,title="Fast Exponential Moving Average, default 21", group = "Trends")
slowMovingAvg = input.int(defval=50, minval=8,title="Slow Exponential Moving Average, default 50", group = "Trends")

rsiLenght = input.int(defval=14, title="RSI Lenght, default 14", group = "Momentum")
overbought = input.int(defval=70, title="Overbought limit (RSI), default 70", group = "Momentum")
oversold = input.int(defval=30, title="Oversold limit (RSI), default 30", group = "Momentum")

hide = input.bool(defval=true, title="Hide all plots and legends from the chart (default: true)")


// Trade related
tradeType = input.string(defval='Both', group="Trade settings", title="Trade Type", options=['Both', 'TrendFollowing', 'Reversal'], tooltip="Consider all types of trades? Or only Trend Following or only Reversal? (default: Both).")
endOfDay = input.int(defval=1500, title="Close all trades, default is 3:00 PM, 1500 hours (integer)", group="Trade settings")
mktAlwaysOn = input.bool(defval=false, title="Markets that never closed (Crypto, Forex, Commodity)", tooltip="Some markers never closes. For those cases, make this checked. (Default: off)", group="Trade settings")


// Utils
annotatePlots(txt, val, hide) =>
    if (not hide)
        var l1 = label.new(bar_index, val, txt, style=label.style_label_left, size = size.tiny, textcolor = color.white, tooltip = txt)
        label.set_xy(l1, bar_index, val)

/////////////////////////////// Indicators /////////////////////
vwap = ta.vwap(src)
plot(hide ? na : vwap, color=color.purple, title="VWAP", style = plot.style_line)
annotatePlots('VWAP', vwap, hide)

// Bollinger Band of present time frame
[BBbasis, BBupper, BBlower] = ta.bb(src, BBlength, BBmult)
p1 = plot(hide ? na : BBupper, color=color.blue,title="Bollinger Bands Upper Line")
p2 = plot(hide ? na : BBlower, color=color.blue,title="Bollinger Bands Lower Line")
p3 = plot(hide ? na : BBbasis, color=color.maroon,title="Bollinger Bands Width", style=plot.style_circles, linewidth = 1)
annotatePlots('BB-Upper', BBupper, hide)
annotatePlots('BB-Lower', BBlower, hide)
annotatePlots('BB-Base(20-SMA)', BBbasis, hide)

// RSI
rsi = ta.rsi(src, rsiLenght)

// Trend following
ema50 = ta.ema(src, slowMovingAvg)
ema21 = ta.ema(src, fastMovingAvg)
annotatePlots('21-EMA', ema21, hide)
annotatePlots('50-EMA', ema50, hide)


// Trend conditions
upTrend = ema21 > ema50
downTrend = ema21 < ema50


// Condition to check Special Entry: HH_LL
// Long side:
hhLLong = barstate.isconfirmed and (low > low[1]) and (high > high[1]) and (close > high[1])
hhLLShort = barstate.isconfirmed and (low < low[1]) and (high < high[1]) and (close < low[1])

longCond =  barstate.isconfirmed and (high[1] < BBlower[1]) and (close > BBlower) and (close < BBupper) and hhLLong and ta.crossover(rsi, oversold) and downTrend
shortCond = barstate.isconfirmed and (low[1] > BBupper[1]) and (close < BBupper) and (close > BBlower) and hhLLShort and ta.crossunder(rsi, overbought) and upTrend

// Trade execute
h = hour(time('1'), syminfo.timezone)
m = minute(time('1'), syminfo.timezone)
hourVal = h * 100 + m
totalTrades = strategy.opentrades + strategy.closedtrades
if (mktAlwaysOn or (hourVal < endOfDay))
    // Entry
    var float sl = na
    var float target = na
    if (longCond)
        strategy.entry("enter long", strategy.long, 1, limit=na, stop=na, comment="Long[E]")
        sl := low[1]
        target := high >= BBbasis ? BBupper : BBbasis
        alert('Buy:' + syminfo.ticker + ' ,SL:' + str.tostring(math.floor(sl)) + ', Target:' + str.tostring(target), alert.freq_once_per_bar)
    if (shortCond)
        strategy.entry("enter short", strategy.short, 1, limit=na, stop=na, comment="Short[E]")
        sl := high[1]
        target := low <= BBbasis ? BBlower : BBbasis
        alert('Sell:' + syminfo.ticker + ' ,SL:' + str.tostring(math.floor(sl)) + ', Target:' + str.tostring(target), alert.freq_once_per_bar)

    // Exit: target or SL
    if ((close >= target) or (close <= sl))
        strategy.close("enter long", comment=close < sl ? "Long[SL]" : "Long[T]")
    if ((close <= target) or (close >= sl))
        strategy.close("enter short", comment=close > sl ? "Short[SL]" : "Short[T]")
else if (not mktAlwaysOn)
    // Close all open position at the end if Day
    strategy.close_all(comment = "EoD[Exit]", alert_message = "EoD Exit", immediately = true)