概述
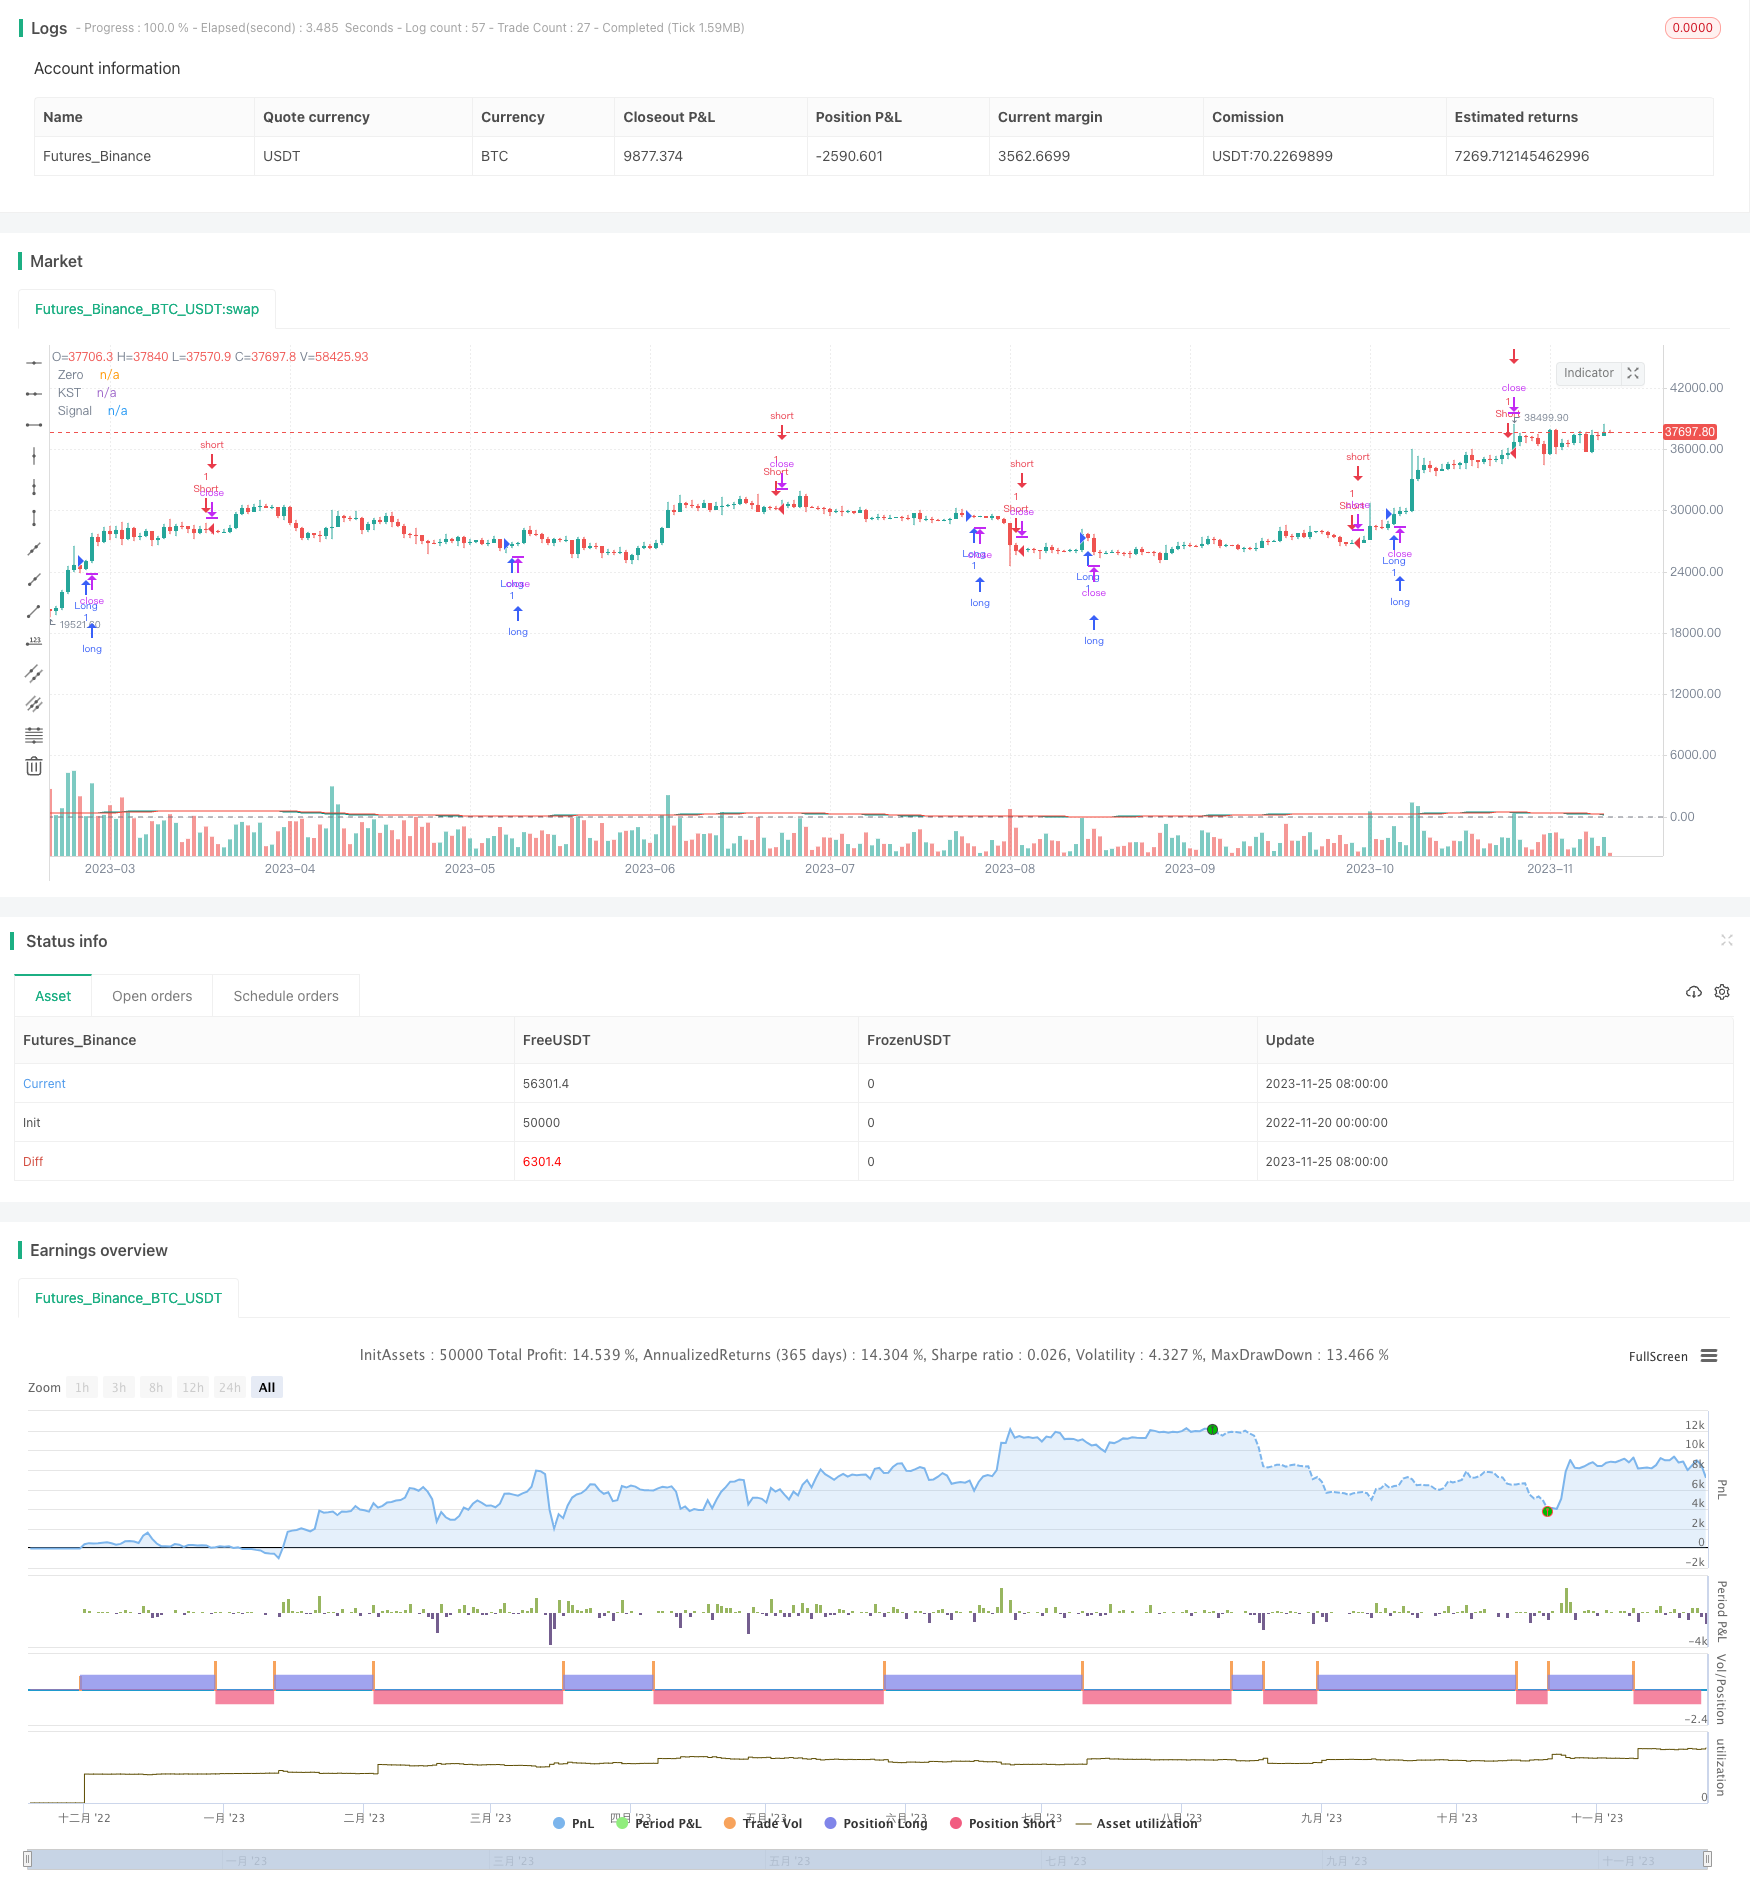
KST指标获利策略是一种应用于SPY 30分钟周期的选股策略。该策略利用KST指标的多空交叉来判断入场和出场时机。
策略原理
该策略主要基于KST指标。KST指标由以下几部分组成:
- ROC长度分别为11、15、20、33的4个不同长度的ROC曲线。
- 对上述ROC曲线分别应用长度为9、14、8、15的SMA平滑。
- 对平滑后的4个ROC曲线求加权和,权重分别为1、2、3、4。
- 对终的KST曲线再应用长度为9的SMA求得Signal曲线。
根据KST曲线和Signal曲线的金叉死叉来判断买卖点:
- KST上穿Signal为买入信号
- KST下穿Signal为卖出信号
优势分析
该策略主要有以下优势:
利用KST指标综合考虑了不同时间周期内的价格变动,使得策略更加稳定和可靠。
KST指标对ROC曲线进行了加权平均,使得更长周期的价格变化起主导作用,有利于捕捉市场趋势。
应用在SPY这种高流动性标的具有良好的实盘效果。
风险分析
该策略也存在一些风险:
KST指标和MA指标一样,在震荡行情中容易产生假信号。可通过调整参数优化。
Entry和Exit完全依赖指标,没有结合股票基本面和大市分析,容易在重大事件发生时产生大亏损。
选股范围仅限于SPY一个标的,可通过扩大选股范围分散单一标的带来的风险。
优化方向
该策略可从以下几个方向进行优化:
优化KST指标参数,寻找最佳参数组合。
结合波动率指标避免震荡行情的假信号。
增加止损策略控制单次亏损。
扩大股票池,适当纳入参数满足条件的个股,提高策略稳定性。
总结
该策略利用KST指标判断股票短线趋势,在SPY上取得了不错效果。我们可通过参数优化、风控措施等方法来提升策略稳定性和实战效果。也可以尝试扩大选股范围,使策略更具普适性。
策略源码
/*backtest
start: 2022-11-20 00:00:00
end: 2023-11-26 00:00:00
period: 1d
basePeriod: 1h
exchanges: [{"eid":"Futures_Binance","currency":"BTC_USDT"}]
*/

//@version=5
strategy("KST Strategy", shorttitle="KST", overlay=true)

roclen1 = input.int(11, minval=1, title="ROC Length #1")
roclen2 = input.int(15, minval=1, title="ROC Length #2")
roclen3 = input.int(20, minval=1, title="ROC Length #3")
roclen4 = input.int(33, minval=1, title="ROC Length #4")
smalen1 = input.int(9, minval=1, title="SMA Length #1")
smalen2 = input.int(14, minval=1, title="SMA Length #2")
smalen3 = input.int(8, minval=1, title="SMA Length #3")
smalen4 = input.int(15, minval=1, title="SMA Length #4")
siglen = input.int(9, minval=1, title="Signal Line Length")

smaroc(roclen, smalen) =>
    ta.sma(ta.roc(close, roclen), smalen)

kst = smaroc(roclen1, smalen1) + 2 * smaroc(roclen2, smalen2) + 3 * smaroc(roclen3, smalen3) + 4 * smaroc(roclen4, smalen4)
sig = ta.sma(kst, siglen)

// Plot the KST and Signal Line
plot(kst, color=#009688, title="KST")
plot(sig, color=#F44336, title="Signal")
hline(0, title="Zero", color=#787B86)

// Strategy logic
longCondition = ta.crossover(kst, sig)
shortCondition = ta.crossunder(kst, sig)

strategy.entry("Long", strategy.long, when=longCondition)
strategy.entry("Short", strategy.short, when=shortCondition)