概述
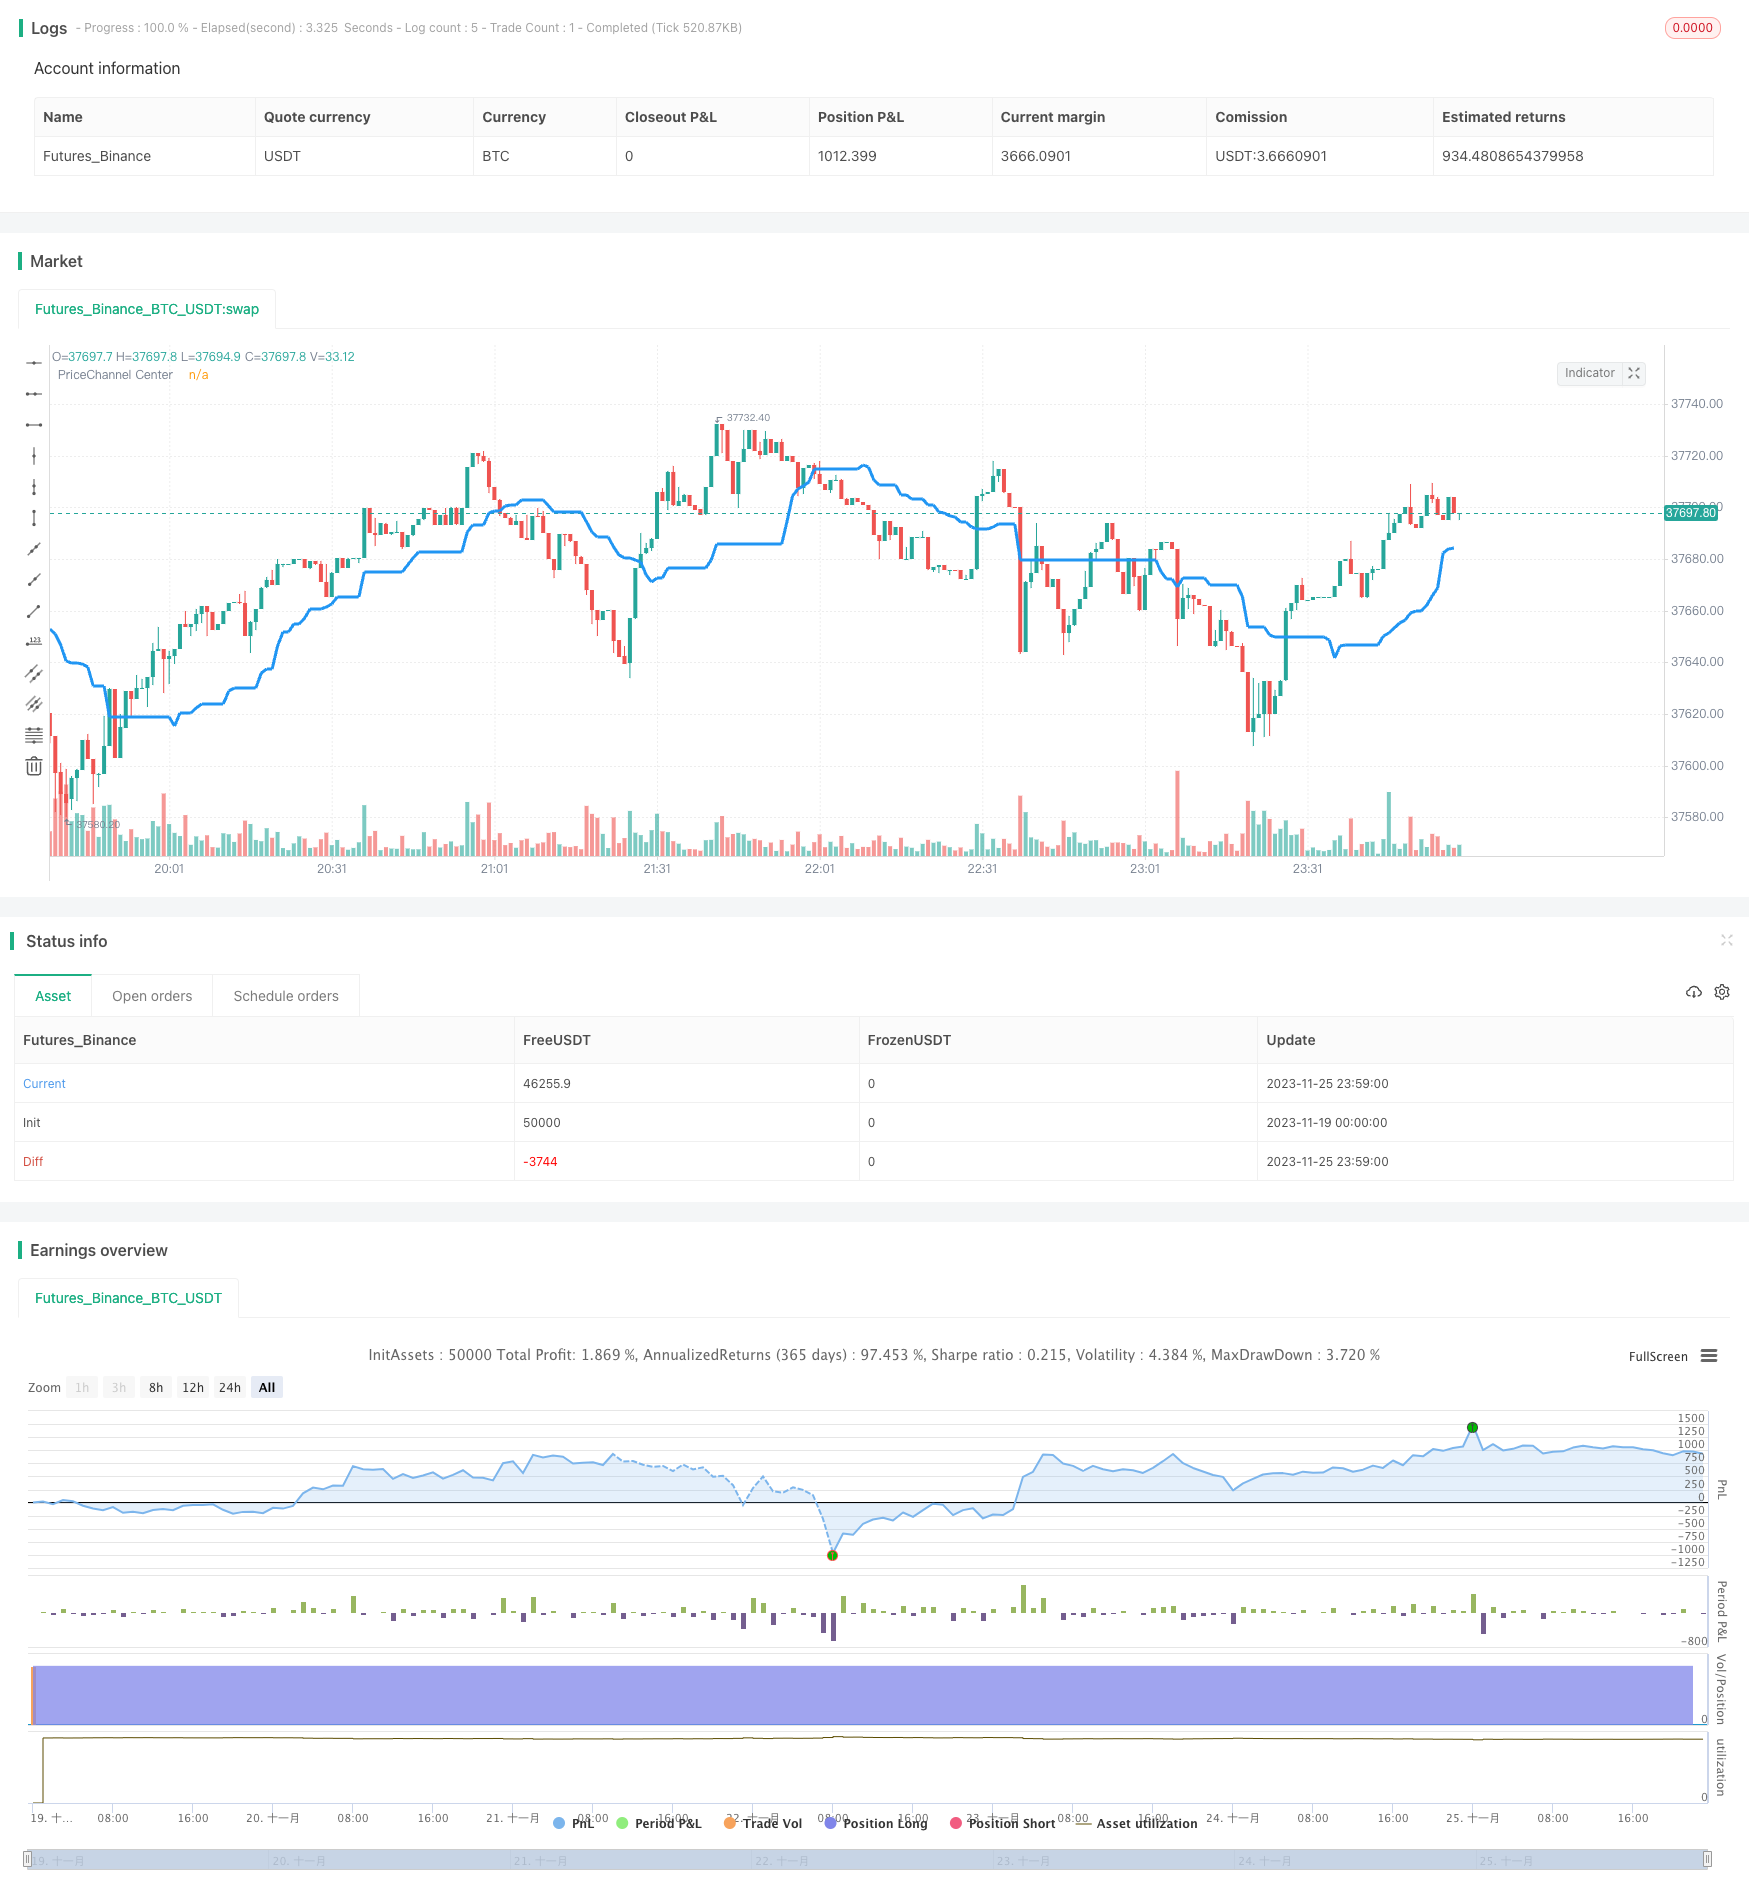
空间导向价格反转策略通过计算价格通道中心线,判断价格波动的趋势方向。当价格接近通道中心线时,发出做多或做空信号。该策略结合多个过滤条件,寻找高概率交易机会。
策略原理
该策略的核心指标是价格通道中心线。计算方式是取最近30根K线的最高价和最低价的平均值。当低点高于中心线时认为是上涨趋势,当高点低于中心线时认为是下跌趋势。
策略只在趋势背景发生转变时发出交易信号。即在上涨背景下,只在K线变红时做空;在下跌背景下,只在K线变绿时做多。
此外,策略还设置双重过滤条件:蜡烛实体过滤和价格通道bars过滤。只有当蜡烛实体体积大于平均值的20%时才会触发信号;过滤周期内必须有连续的趋势信号才会开仓。
优势分析
该策略结合趋势、价值区域和K线形态,是一种高效的反转交易策略。主要优势有:
- 使用价格通道判断主要趋势,避免被震荡市场误导。
- 点位选择价格通道中心线附近,是经典的低买高卖区域。
- K线实体和通道bars过滤增加信号质量,降低了错误信号率。
- 只在明确的反转点开仓,避免追高杀跌。
风险及解决方法
该策略主要风险来自错过价格反转点而无谓等待信号。可通过以下方法优化:
- 调整过滤条件严格程度,降低过滤标准可减少漏单率。
- 可在反转趋势初期加大仓位,追踪趋势利润。
- 结合其他指标判断反转信号强度,主观干预过滤条件。
优化方向
该策略可从以下几个方面进行优化:
- 优化参数,如调整价格通道周期,通道bars数等参数。
- 增加止损策略,在亏损达到一定比例时止损。
- 结合交易量,量能干预过滤条件强度。如量能放大时放宽过滤。
- 增加机器学习模型判断趋势转折概率,取代简单过滤。
总结
空间导向价格反转策略通过价格通道判断反转时点,设置双重过滤条件生成高质量信号。在参数调优和风控的基础上,是一种可靠的量化策略。
策略源码
/*backtest
start: 2023-11-19 00:00:00
end: 2023-11-26 00:00:00
period: 1m
basePeriod: 1m
exchanges: [{"eid":"Futures_Binance","currency":"BTC_USDT"}]
*/

//Noro
//2018

//@version=2
strategy(title = "Noro's PriceChannel for D1 v1.0", shorttitle = "PriceChannel D1", overlay = true, default_qty_type = strategy.percent_of_equity, default_qty_value = 100.0, pyramiding = 0)

//Settings
needlong = input(true, "long")
needshort = input(true, "short")
slowlen = input(30, defval = 30, minval = 2, maxval = 200, title = "PriceChannel Period")
pcbars = input(1, defval = 1, minval = 1, maxval = 20, title = "PriceChannel Bars")
usecol = input(true, "Use color-filter")
usebod = input(true, "Use body-filter")
needbg = input(false, defval = false, title = "Need trend Background?")
fromyear = input(1900, defval = 1900, minval = 1900, maxval = 2100, title = "From Year")
toyear = input(2100, defval = 2100, minval = 1900, maxval = 2100, title = "To Year")
frommonth = input(01, defval = 01, minval = 01, maxval = 12, title = "From Month")
tomonth = input(12, defval = 12, minval = 01, maxval = 12, title = "To Month")
fromday = input(01, defval = 01, minval = 01, maxval = 31, title = "From day")
today = input(31, defval = 31, minval = 01, maxval = 31, title = "To day")

src = close

//PriceChannel
lasthigh = highest(src, slowlen)
lastlow = lowest(src, slowlen)
center = (lasthigh + lastlow) / 2

//Trend
ub = low > center ? 1 : 0
db = high < center ? 1 : 0
trend = sma(ub, pcbars) == 1 ? 1 : sma(db, pcbars) == 1 ? -1 : trend[1]

//Body
body = abs(close - open)
abody = sma(body, 10)

//Signals
up = trend == 1 and (close < open or usecol == false) and (body > abody / 5 or usebod == false)
dn = trend == -1 and (close > open or usecol == false) and (body > abody / 5 or usebod == false)

//Lines
plot(center, color = blue, linewidth = 3, transp = 0, title = "PriceChannel Center")

//Background
col = needbg == false ? na : trend == 1 ? lime : red
bgcolor(col, transp = 80)

//Trading
if up
    strategy.entry("Long", strategy.long, needlong == false ? 0 : na, when=(time > timestamp(fromyear, frommonth, fromday, 00, 00) and time < timestamp(toyear, tomonth, today, 23, 59)))

if dn
    strategy.entry("Short", strategy.short, needshort == false ? 0 : na, when=(time > timestamp(fromyear, frommonth, fromday, 00, 00) and time < timestamp(toyear, tomonth, today, 23, 59)))

if time > timestamp(toyear, tomonth, today, 23, 59)
    strategy.close_all()