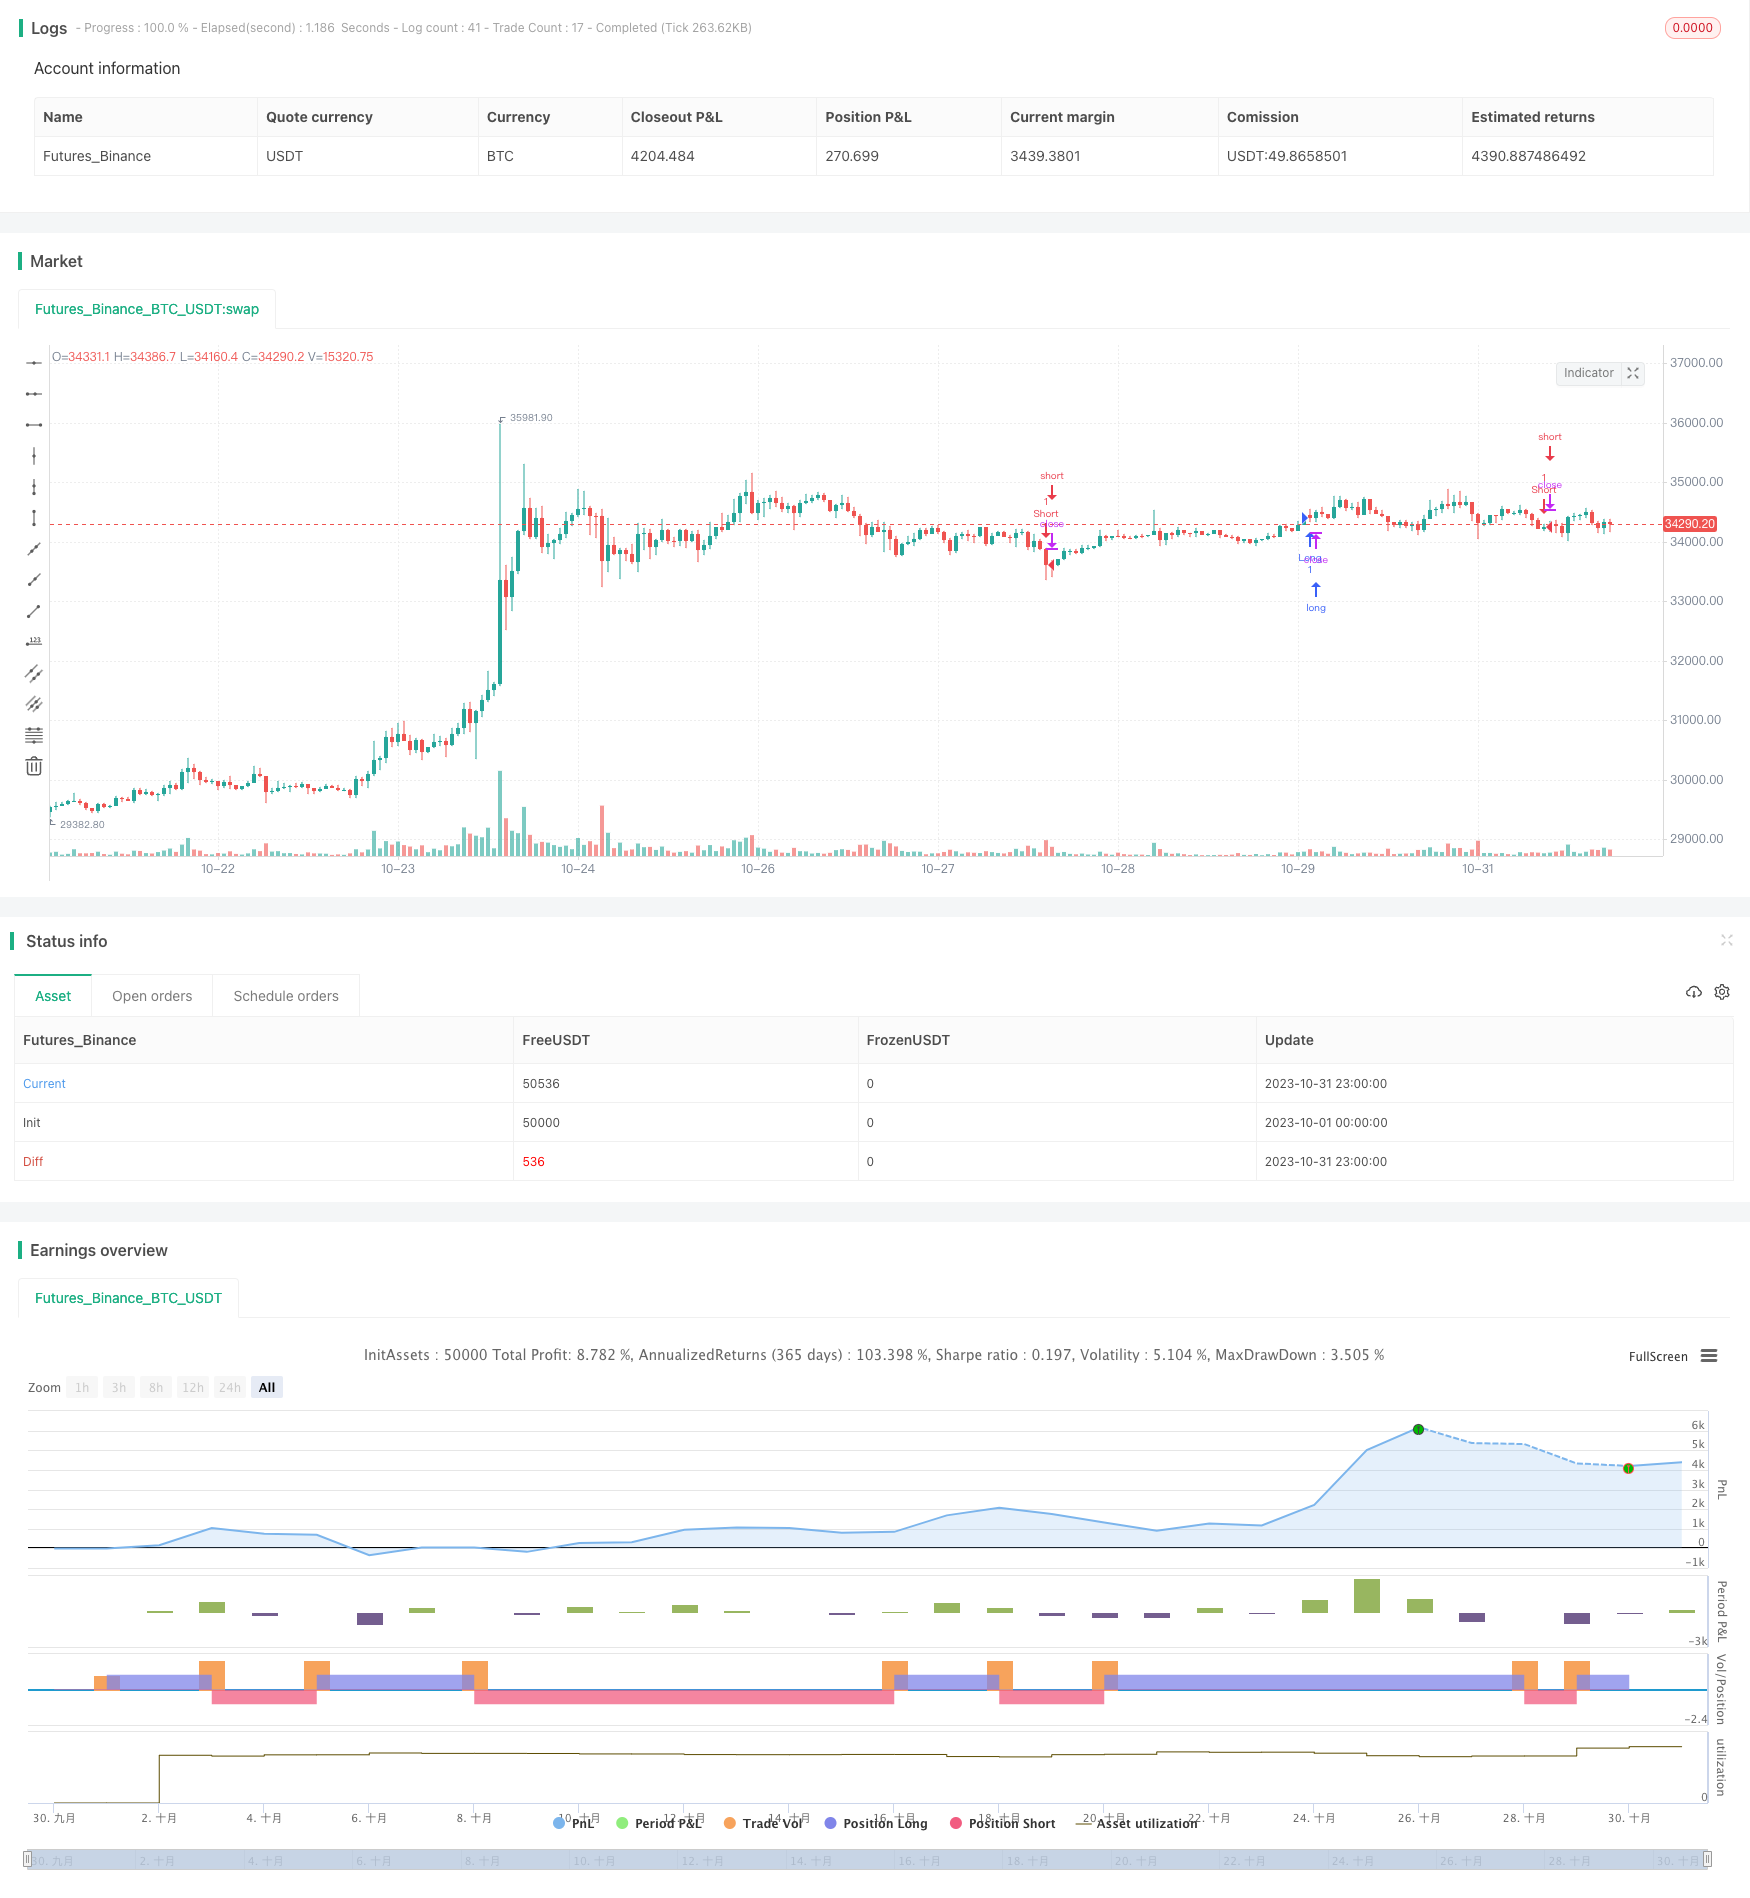
一、策略概述
本策略综合运用一目均衡表、Macd指标、Chaikin金流指标和Tsi震荡指标等多种技术指标,实现精准判断市场趋势方向,进行短线交易。
二、策略原理
策略运用一目均衡表中的天平线、基准线、先行线等指标判断日内价格趋势。同时结合Macd的快慢均线交叉信号,以及金流指标和震荡指标判断资金流入流出。多种指标综合判断后进行买卖决策。
当天平线上穿基准线,先行线在0轴之上,收盘价在一目均衡表的云端之上时为看涨信号。反之当天平线下穿基准线,先行线在0轴之下,收盘价在云端之下时为看跌信号。策略同时检测Macd的直方图是否为正值以及Chaikin金流指标和震荡指标是否同向为正,若指标同向看涨,则进行买入开多;若指标同向看跌,则进行卖出开空。
当指标发出与之前相反信号时,进行反向交易平掉之前头寸。
三、策略优势
运用多种指标综合判断,提高判断准确性。
短线操作,跟踪市场实时波动。
无需人工干预,全自动算法交易。
四、策略风险及解决方法
多种指标同向看涨看跌的判断容易产生误判风险。可适当放宽部分判定条件,降低误判率。
高频短线交易较高手续费率以及难以抓住趋势。可适当延长持仓周期,追求超额收益以弥补成本。
无止损设置可能造成较大亏损。可结合ATR来设定合适的止损点或移动止损。
五、策略优化方向
优化参数组合。调整均线参数,适配不同周期和品种。
增加止损机制。结合ATR指标来动态设定移动止损线。
增加仓位管理。动态调整交易量比例。
结合机器学习技术对指标和信号进行优化。
六、总结
本策略综合运用多种技术指标判断趋势实时波动,进行高频短线交易。虽然存在一定风险,但可通过优化来改进。该策略值得进一步深入研究和实盘验证,通过增加止损以及仓位管理来降低交易风险。
策略源码
/*backtest
start: 2023-10-01 00:00:00
end: 2023-10-31 23:59:59
period: 1h
basePeriod: 15m
exchanges: [{"eid":"Futures_Binance","currency":"BTC_USDT"}]
*/

// This source code is subject to the terms of the Mozilla Public License 2.0 at https://mozilla.org/MPL/2.0/
// © exlux99

//@version=4
strategy("Ichimoku with MACD/ CMF/ TSI", overlay=true, margin_long=0, margin_short=0)


//Inputs
ts_bars = input(10, minval=1, title="Tenkan-Sen Bars")
ks_bars = input(30, minval=1, title="Kijun-Sen Bars")
ssb_bars = input(52, minval=1, title="Senkou-Span B Bars")
cs_offset = input(26, minval=1, title="Chikou-Span Offset")
ss_offset = input(26, minval=1, title="Senkou-Span Offset")
long_entry = input(true, title="Long Entry")
short_entry = input(true, title="Short Entry")

middle(len) => avg(lowest(len), highest(len))

// Ichimoku Components
tenkan = middle(ts_bars)
kijun = middle(ks_bars)
senkouA = avg(tenkan, kijun)
senkouB = middle(ssb_bars)


ss_high = max(senkouA[ss_offset-1], senkouB[ss_offset-1])
ss_low = min(senkouA[ss_offset-1], senkouB[ss_offset-1])

// Entry/Exit Signals
fast_length = input(title="Fast Length", type=input.integer, defval=17)
slow_length = input(title="Slow Length", type=input.integer, defval=28)
src = input(title="Source", type=input.source, defval=close)
signal_length = input(title="Signal Smoothing", type=input.integer, minval = 1, maxval = 50, defval = 5)
sma_source = input(title="Simple MA(Oscillator)", type=input.bool, defval=true)
sma_signal = input(title="Simple MA(Signal Line)", type=input.bool, defval=true)

// Calculating
fast_ma = sma_source ? sma(src, fast_length) : ema(src, fast_length)
slow_ma = sma_source ? sma(src, slow_length) : ema(src, slow_length)
macd = fast_ma - slow_ma
signal = sma_signal ? sma(macd, signal_length) : ema(macd, signal_length)
hist = macd - signal


tk_cross_bull = tenkan > kijun
tk_cross_bear = tenkan < kijun
cs_cross_bull = mom(close, cs_offset-1) > 0
cs_cross_bear = mom(close, cs_offset-1) < 0
price_above_kumo = close > ss_high
price_below_kumo = close < ss_low


//CMF
lengthA = input(8, minval=1, title="CMF Length")
ad = close==high and close==low or high==low ? 0 : ((2*close-low-high)/(high-low))*volume
mf = sum(ad, lengthA) / sum(volume, lengthA)


//TSI
long = input(title="Long Length", type=input.integer, defval=8)
short = input(title="Short Length", type=input.integer, defval=8)
price = close
double_smooth(src, long, short) =>
	fist_smooth = ema(src, long)
	ema(fist_smooth, short)
pc = change(price)
double_smoothed_pc = double_smooth(pc, long, short)
double_smoothed_abs_pc = double_smooth(abs(pc), long, short)
tsi_value = 100 * (double_smoothed_pc / double_smoothed_abs_pc)


bullish = tk_cross_bull and cs_cross_bull and price_above_kumo and hist > 0 and mf > 0.1 and tsi_value > 0
bearish = tk_cross_bear and cs_cross_bear and price_below_kumo and hist < 0  and mf < -0.1 and tsi_value < 0


strategy.entry("Long", strategy.long, when=bullish and long_entry)
strategy.entry("Short", strategy.short, when=bearish and short_entry)

strategy.close("Long", when=bearish and not short_entry)
strategy.close("Short", when=bullish and not long_entry)