Trend Tracking Flag Pattern Strategy Based on EMA Indicators

Overview
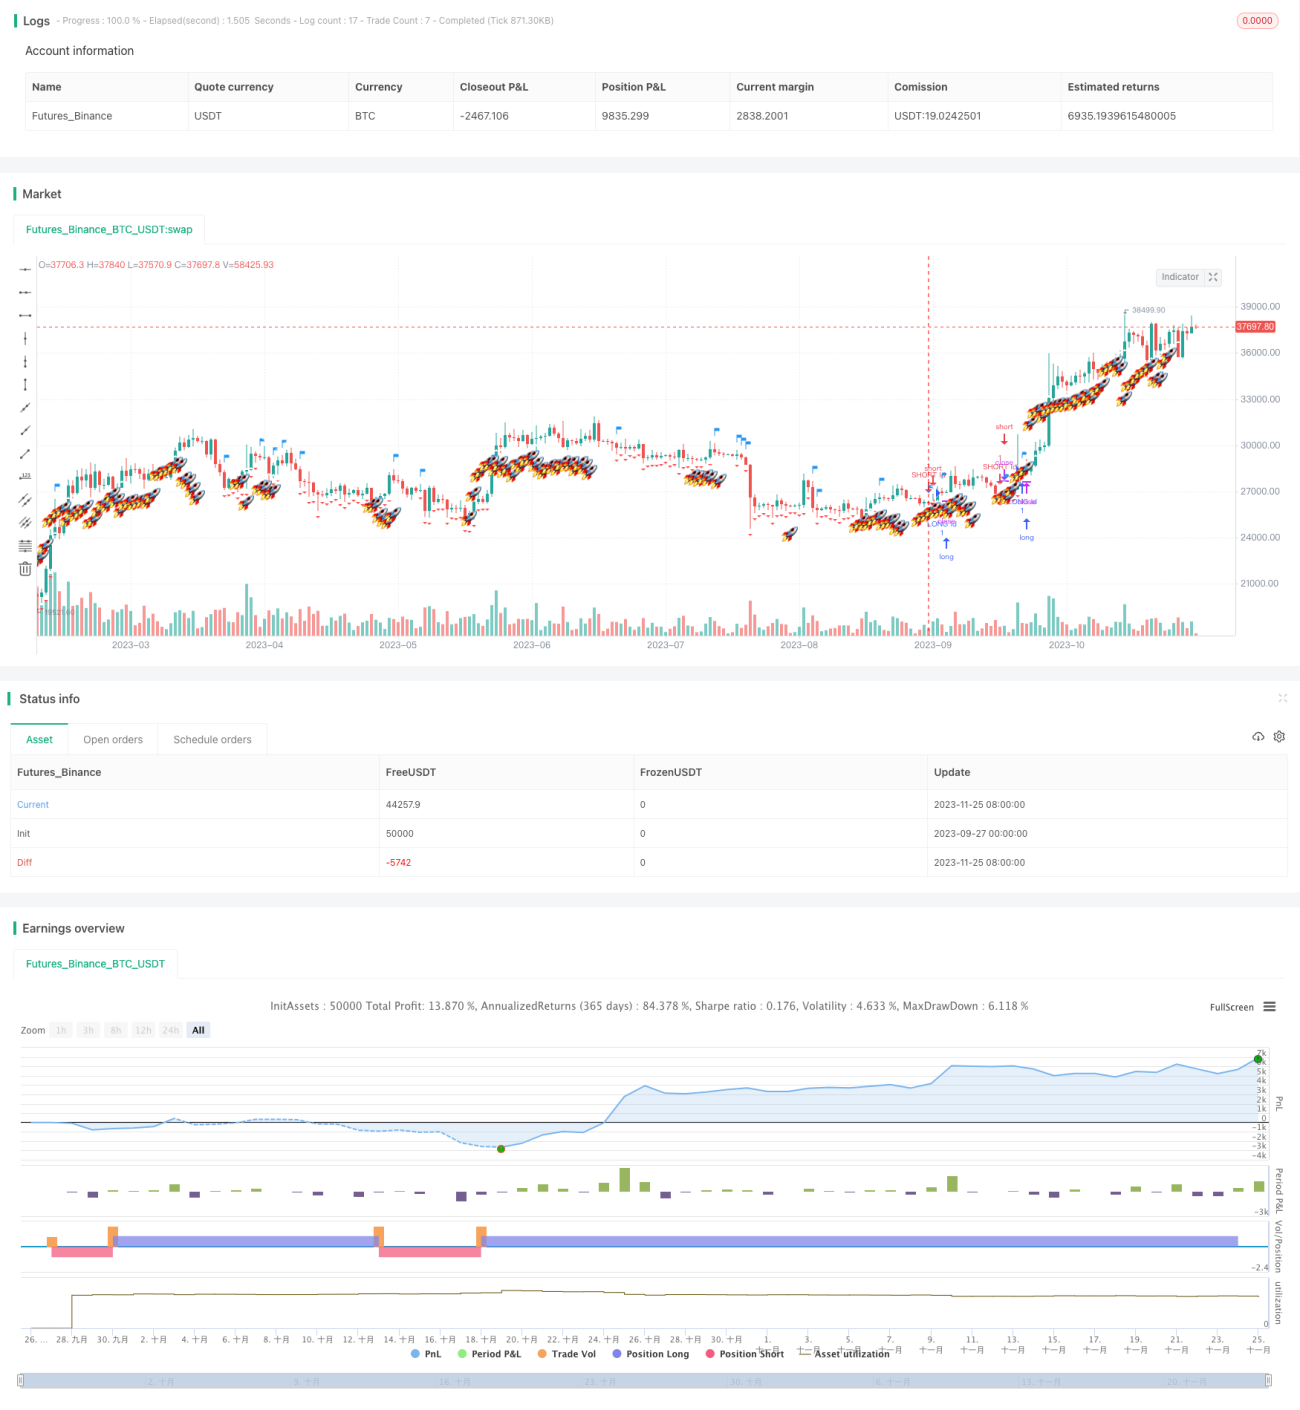
This strategy mainly uses EMA and standard deviation indicators to determine the trend direction through EMA cross signals and look for breakout signals with standard deviation to generate buy and sell signals. It belongs to the trend tracking type of strategy that generates buy signals when prices break through the upper rail and sell signals when prices break through the lower rail.
Strategy Logic
The strategy consists of three main parts:
-
EMA Difference (s2): Calculate the difference between fast EMA (ema_range) and slow EMA (ema_watch) to determine the price trend direction.
-
Standard Deviation Channel (s3): Build upper and lower channel based on EMA difference with multiples of standard deviation. The standard deviation multiplier uses the golden ratio 5.618.
-
Flags and Signals: Generate buy signals when prices break through the upper rail from bottom up, and sell signals when prices break through the lower rail from top down. Flag shapes are used to mark the signals.
Through this combination of indicators, it can capture the trend direction of prices and generate buy and sell signals at key points, which belongs to a typical trend tracking strategy.
Advantage Analysis
The strategy has the following advantages:
- EMA can effectively track trends.
- Standard deviation builds channels to avoid false signals.
- Flag shapes make signals clear.
- Flexible parameter settings of moving averages and standard deviation multiples.
- Maximum drawdown control helps reduce risks.
Risk Analysis
There are also some risks:
- More false signals may occur in range-bound markets.
- Too large standard deviation multiples may miss opportunities.
- No stop loss may lead to larger losses during retracements.
The solutions:
- Add range-bound market judgment and use other strategies instead.
- Optimize standard deviation parameters.
- Add moving stop loss to control loss of individual trades.
Optimization
The strategy can be optimized in the following directions:
- Add more indicators like Bollinger Bands to improve signal quality.
- Optimize moving average and standard deviation parameters.
- Add stop loss strategies to reduce drawdowns.
- Set optimal buy/sell signal parameters according to different markets.
- Add machine learning algorithms to determine overall market regime.
Conclusion
In summary, this is a typical trend tracking strategy using EMA and standard deviation to build an indicator system and generate flag signals at key points. The advantages lie in catching trends and avoiding false signals with standard deviation. The main risks come from wrong signals in range-bound markets and drawdown risks due to no stop loss. By adding judgment indicators, optimizing parameters and adding stop loss, the strategy can be further enhanced in terms of stability and profitability. Overall, the strategy framework is reasonable and has great potential for optimization.
- 1