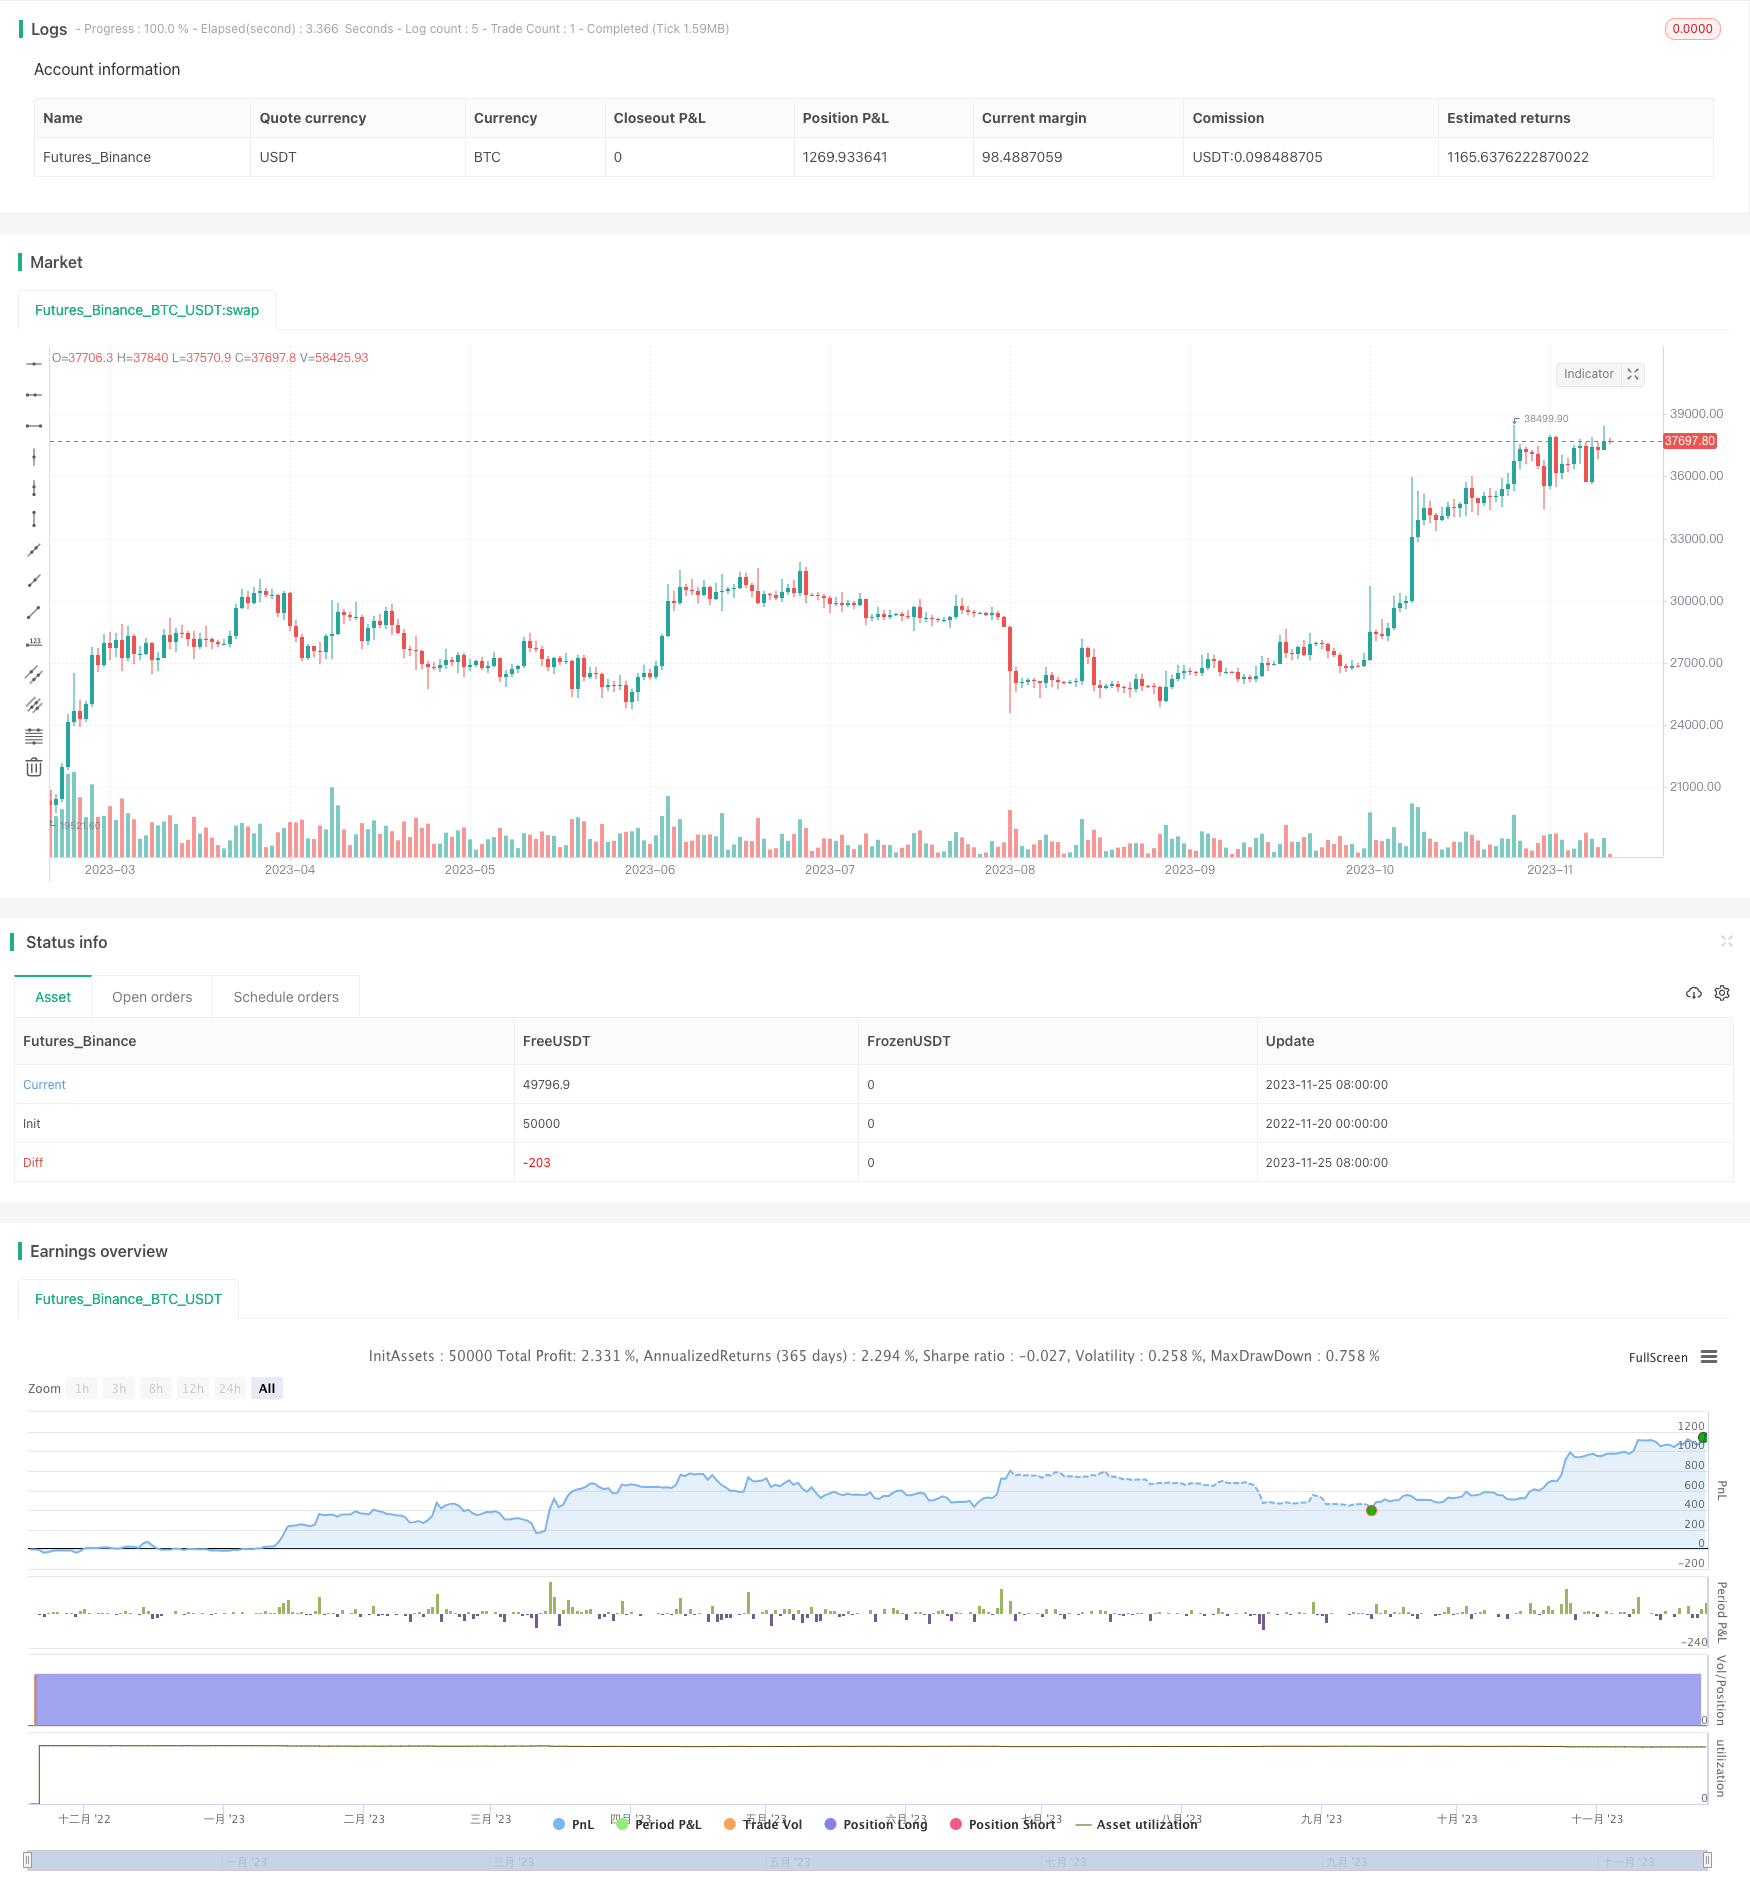
Quantitative Trading Strategy Based on RSI Indicator

Author: ChaoZhang, Date: 2023-11-27 16:02:14
Tags:

img

Strategy Overview

The strategy is named “PlanB RSI Tracking Strategy”. It utilizes the Relative Strength Index (RSI) as the primary technical indicator to set up buy and sell signals for automated trading.

Strategy Logic

The strategy is mainly based on the following principles:

  1. If the highest RSI index in the past 6 months exceeds 90% and then drops below 65%, a sell signal is generated.

  2. If the lowest RSI index in the past 6 months falls below 50% and then bounces more than 2% from the lowest point, a buy signal is generated.

Specifically, the sell logic is:

If (Highest RSI in past 6 months > 90% AND Current RSI < 65%) 
   Then Sell

The buy logic is:

If (Lowest RSI in past 6 months < 50% AND RSI bounces >2% from lowest point)
   Then Buy

The above sell and buy rules come from the article by PlanB, a well-known quant strategist. The strategy aims to replicate his research results for more traders to validate the effectiveness of this trading strategy.

Advantages of the Strategy

This trading strategy has the following main advantages:

  1. Using RSI as the only technical indicator reduces complexity.

  2. Clear buy and sell rules that are easy to understand for live trading verification.

  3. Buy and sell signals incorporate both long-term peak/bottom and short-term bounce/breakdown market information.

  4. The strategy references research from renowned quant PlanB, allowing independent verification of his conclusions.

  5. As a beginner strategy with relatively simple rules, it helps nurture quant trading skills.

Risks of the Strategy

There are also some key risks for this trading strategy:

  1. Relying solely on RSI, it cannot handle more complex market regimes. RSI itself also gives false signals.

  2. Fixed parameter settings may miss trades or give delayed signals. Optimization is needed for adapting across market cycles.

  3. Following PlanB blindly without independent optimization risks poor live performance.

  4. Raw buy/sell rules without stop loss or take profit may lead to large losses in live trading.

Below optimizations could help reduce risks and improve live performance:

  1. Add secondary indicators to avoid RSI false signals.

  2. Optimize parameters for different cycle characteristics.

  3. Add stop loss / take profit mechanisms for risk control.

  4. Train strategy parameters independently to ensure robustness.

Directions for Strategy Optimization

To enhance live performance, optimizations can be made in the following dimensions:

  1. Add secondary indicators: Relying solely on RSI risks false signals. Incorporate indicators like KD, MACD for composite judgment and improve accuracy.

  2. Dynamic parameter optimization: Current parameter values are fixed, failing to adapt across market cycles. Introduce dynamic optimization modules to adjust parameters in real-time for significantly improved performance.

  3. Stop loss/take profit: Currently lacking risk management features. Adding trailing stop loss, moving take profit points can effectively control single trade loss and lock in gains.

  4. Independent parameter training: Directly using PlanB article parameters without verification. Apply machine learning to find optimal parameter combinations based on historical data.

  5. Portfolio optimization: Combining multiple simple strategies improves overall stability and risk-adjusted returns.

Conclusion

The “PlanB RSI Tracking Strategy” follows the design philosophy in PlanB’s classic article, constructing a simple quant trading strategy based on RSI. The advantages lie in its clarity and ease of implementation, making it suitable for quant starter education. However, sole reliance on a single indicator and lack of optimization remain as issues. Future enhancements can be made via adding secondary indicators, dynamic parameter optimization, stop loss/take profit, independent parameter training to significantly improve live performance.


/*backtest
start: 2022-11-20 00:00:00
end: 2023-11-26 00:00:00
period: 1d
basePeriod: 1h
exchanges: [{"eid":"Futures_Binance","currency":"BTC_USDT"}]
*/

// This source code is subject to the terms of the Mozilla Public License 2.0 at https://mozilla.org/MPL/2.0/
// © fillippone

//@version=4

strategy("PlanB Quant Investing 101", shorttitle="PlanB RSI Strategy", overlay=true,calc_on_every_tick=false,pyramiding=0, default_qty_type=strategy.cash,default_qty_value=1000, currency=currency.USD, initial_capital=1000,commission_type=strategy.commission.percent, commission_value=0.0)


r=rsi(close,14)

//SELL CONDITION
//RSI was above 90% last six months AND drops below 65%

//RSI above 90% last six month

selllevel = input(90)
maxrsi = highest(rsi(close,14),6)[1]

rsisell = maxrsi > selllevel 


//RSIdrops below 65%
drop = input(65)

rsidrop= r < drop

//sellsignal
sellsignal = rsisell and rsidrop 


//BUY CONDITION
//IF (RSI was below 50% last six months AND jumps +2% from the low) THEN buy, ELSE hold.

//RSI was below 50% last six months

buylevel = input(50)
minrsi = lowest(rsi(close,14),6)[1]

rsibuy = minrsi < buylevel 

//IF (RSI jumps +2% from the low) THEN buy, ELSE hold.


rsibounce= r > (minrsi + 2)

//buysignal=buyrsi AND rsidrop

//buysignal

buysignal = rsibuy and rsibounce 

//Strategy

strategy.entry("Buy Signal",strategy.long, when = buysignal)
strategy.entry("Sell Signal",strategy.short, when = sellsignal)


More