Range Breakthrough Dual Moving Average Filtering Strategy

Overview
This is a strategy that utilizes moving averages and Bollinger Bands for trend judgment, combined with breakout filtering and stop loss principles. It can capture signals in a timely manner when trend changes, reduce false signals through dual moving average filtering, and control risks by setting stop loss.
Strategy Principle
The strategy consists of the following main parts:
-
Trend judgment: Use MACD to judge the price trend and distinguish bullish and bearish trends.
-
Range filtering: Use Bollinger Bands to judge the price fluctuation range and filter out signals that do not break through the range.
-
Dual moving average confirmation: The fast EMA and slow EMA form the dual moving average to confirm trend signals. Buy signals are generated only when fast EMA > slow EMA.
-
Stop loss mechanism: Set stop loss points. Close positions when prices break through stop loss points in unfavorable directions.
The logic for entry signals is:
- MACD judges an upward trend
- Price breaks through the upper rail of Bollinger Bands
- Fast EMA is higher than slow EMA
When all three conditions are met at the same time, a buy signal is generated.
There are two types of closing positions, take profit and stop loss. The take profit point is the entry price multiplied by a certain percentage, and the stop loss point is the entry price multiplied by a certain percentage. When the price breaks through either point, close positions.
Advantage Analysis
The advantages of this strategy are:
- Can capture trend changes in a timely manner with fewer tracebacks.
- Reduce false signals by filtering with dual moving averages, improving signal quality.
- The stop loss mechanism effectively controls single loss.
- Large parameter optimization space that can be adjusted to the optimal state.
Risk Analysis
There are also some risks in this strategy:
- False signals generated in sideways markets may lead to losses.
- Improper settings of stop losses may lead to unnecessary losses.
- Inappropriate parameters may result in poor strategy performance.
To address these risks, the strategy can be optimized by adjusting parameters, setting stop loss positions, etc.
Optimization Directions
The strategy can be optimized in the following aspects:
- Adjust the dual moving average length to find the optimal parameter combination.
- Test different stop loss methods, such as trailing stop loss, oscillating stop loss, etc.
- Test MACD parameters to find the optimal settings.
- Use machine learning for automated parameter optimization.
- Add additional conditions to filter signals.
By testing different parameter settings and evaluating returns and Sharpe ratios, the optimal state of the strategy can be found.
Conclusion
This is a quantitative strategy that utilizes trend judgment, range filtering, dual moving average confirmation and stop loss ideas. It can effectively determine the trend direction and strike a balance between profit maximization and risk control. Through parameter optimization, machine learning and other means, the strategy has great room for improvement to achieve better results.
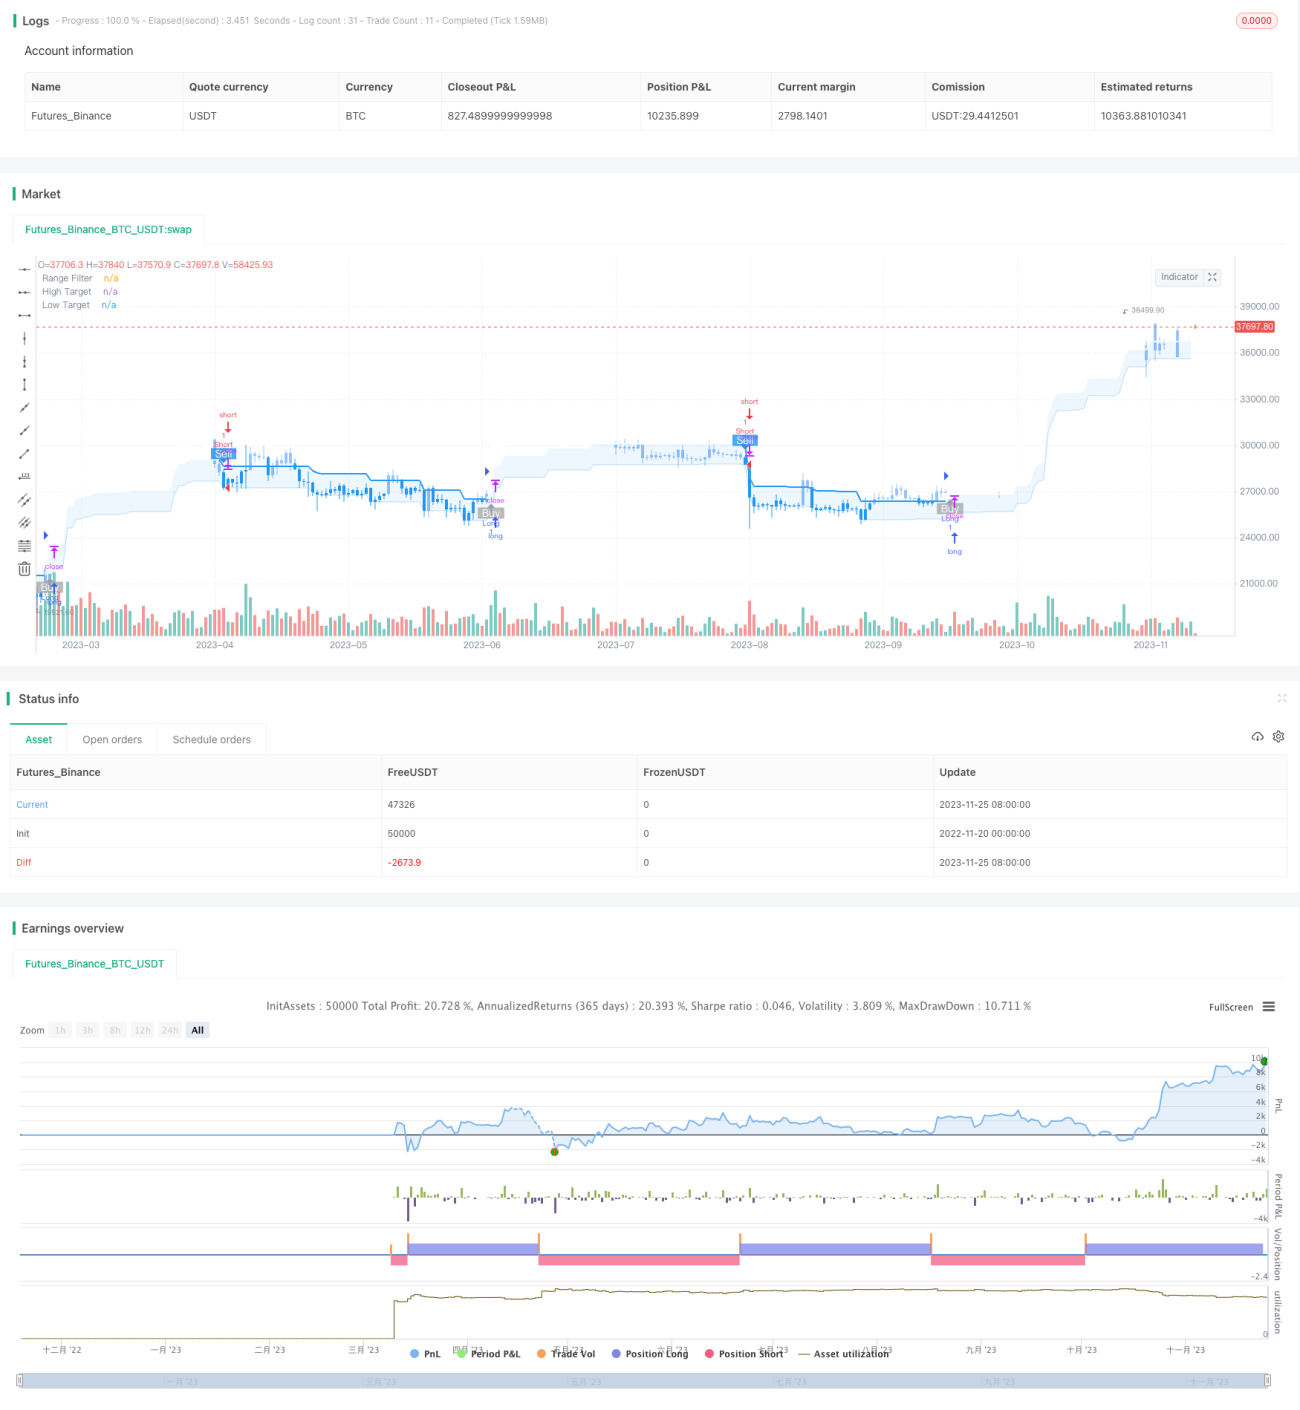
/*backtest
start: 2022-11-20 00:00:00
end: 2023-11-26 00:00:00
period: 1d
basePeriod: 1h
exchanges: [{"eid":"Futures_Binance","currency":"BTC_USDT"}]
*/

//@version=5
strategy(title="Range Filter Buy and Sell Strategies", shorttitle="Range Filter Strategies", overlay=true,pyramiding = 5)

// Original Script > @DonovanWall- 1