Momentum Smooth Moving Average Line and Moving Average Line Crossover Strategy

Author: ChaoZhang, Date: 2023-11-27 17:35:09
Tags:

img

Overview

This strategy uses the crossover of the Momentum Smooth Moving Average Line (ALMA) and two Exponential Moving Average Lines (EMA) with different parameter settings to generate trading signals. At the same time, the strategy also incorporates the Stochastic RSI to avoid excessive buying and selling.

Strategy Principle

Momentum ALMA Line

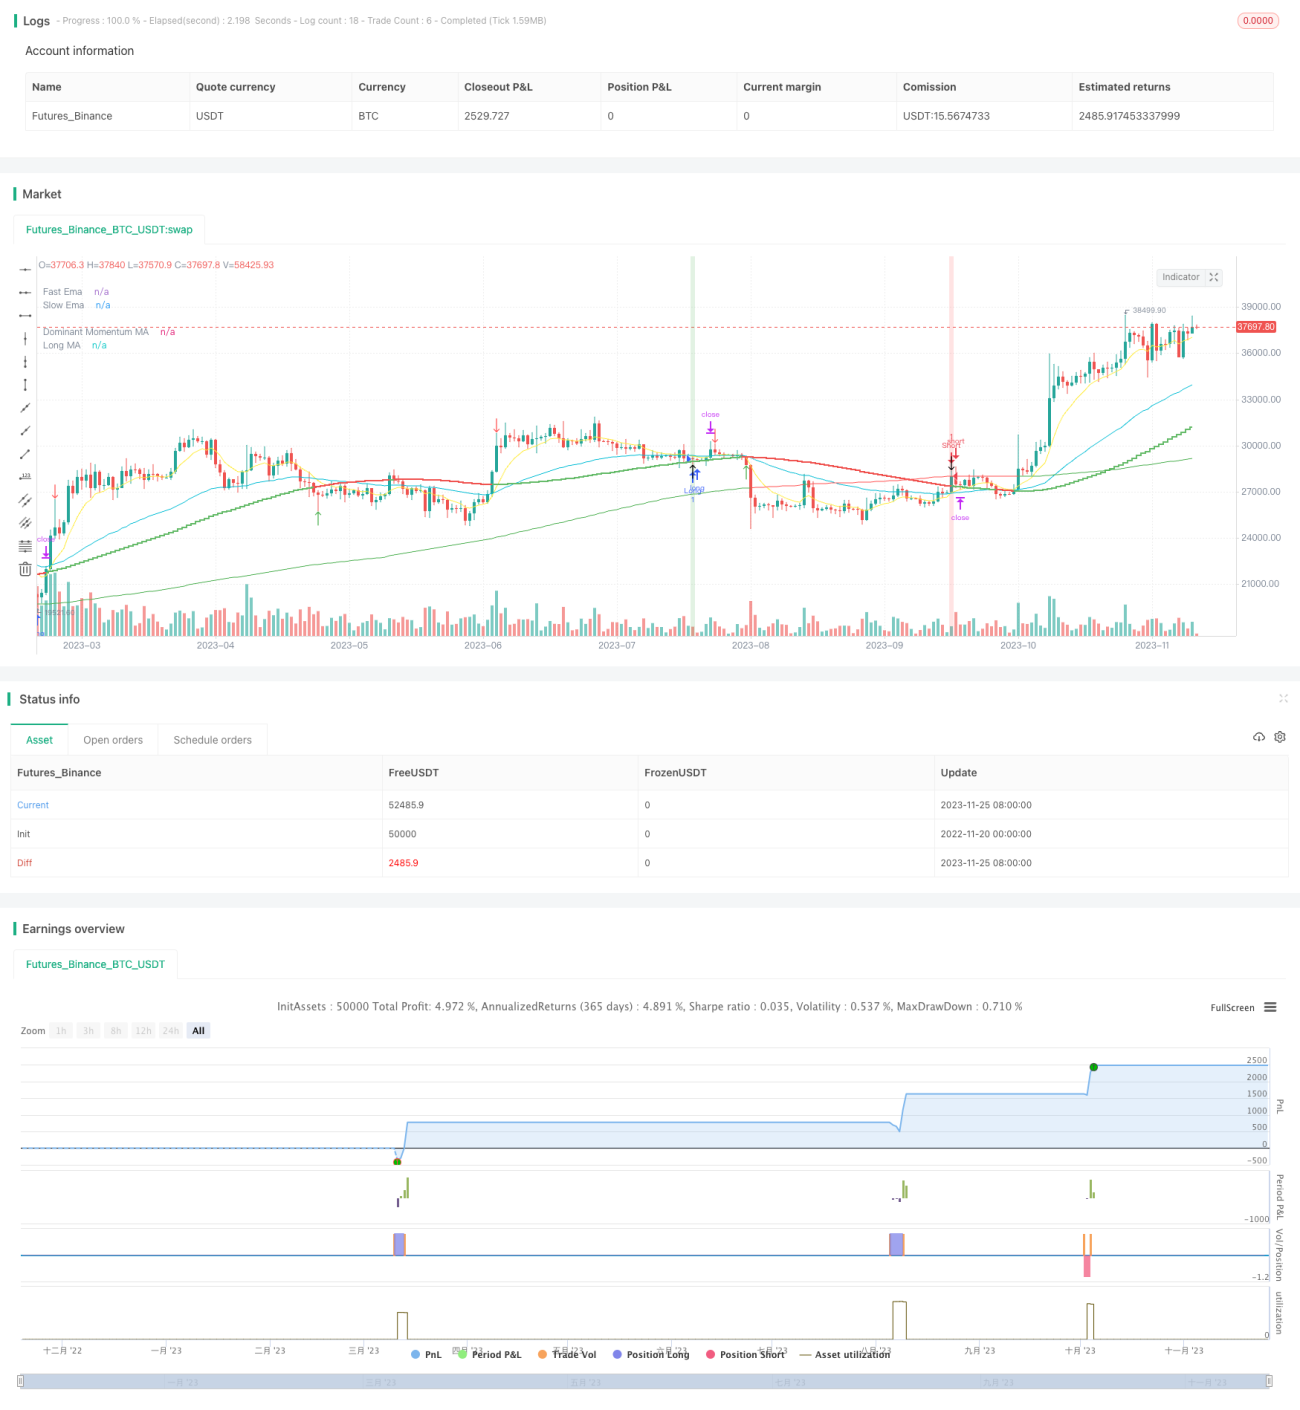
The strategy uses ALMA as the main indicator to judge the price trend. ALMA has the function of smoothing price data and can filter out random fluctuations in prices. By adjusting the period, offset value and sigma parameters of ALMA, it can be made more sensitive or stable. When prices rise, ALMA will show green, and when prices fall, ALMA will show red.

Fast and Slow EMA Crossover

The strategy uses two EMA lines with different lengths. When the fast EMA line crosses above the slow EMA line, a buy signal is generated. When the fast EMA line crosses below the slow EMA, a sell signal is generated. The EMA crossover has good trend judgment ability. The periods of the fast and slow EMAs can be adjusted through parameters to adapt to different trading varieties and cycles.

Stochastic RSI

The role of the Stochastic RSI indicator is to avoid issuing trading signals in overbought and oversold areas. It combines the advantages of both the RSI and Stochastic indicators, and can better determine peak and trough areas. When the Stochastic RSI indicator is overbought or oversold, the strategy will cancel existing long or short orders.

Advantage Analysis

Trading along trends

The strategy makes full use of the EMA crossover to determine the direction of the price trend, combined with the ALMA indicator to locate major long and short opportunities to implement trend trading.

Adjustable parameters

The periods of EMA and ALMA parameters provide adjustable space. Users can optimize the parameters according to their needs to make the strategy better adapt to different market environments.

Stop loss and take profit mechanism

The strategy has built-in stop loss and take profit settings. Using floating stop loss can reduce the probability of stop loss being chased; profit taking settings can lock in profits and avoid spitting out profits.

Risk Analysis

Wrong trend judgment

In complex markets, EMA and ALMA lines may issue wrong signals. Rely on stop loss to control losses.

Improper parameter settings

If the parameters are set improperly, the EMA and ALMA lines cannot function correctly, which will increase trading risks. Testing and optimization are needed to select the best parameter combination.

Strategy Optimization

  1. Test and optimize the parameter settings of EMA and ALMA to select the optimal parameters.

  2. Incorporate other indicators to filter signals and avoid losses caused by wrong signals. Such as MACD, KDJ, etc.

  3. Optimize the stop loss magnitude to find a balance between risk control and profitability.

  4. Test different varieties and cycle parameters to apply the strategy to more markets.

Summary

Overall, this is a simple and practical trend tracking strategy. It uses EMA crossover to determine the trend direction, ALMA indicator to locate add-on points, Stochastic RSI to avoid risks of overbought and oversold, while setting stop loss and take profit to control risks. Through parameter adjustment and indicator optimization, this strategy can achieve good results. It is easy to understand and use, and also has a certain adaptability.


/*backtest
start: 2022-11-20 00:00:00
end: 2023-11-26 00:00:00
period: 1d
basePeriod: 1h
exchanges: [{"eid":"Futures_Binance","currency":"BTC_USDT"}]
*/

//@version=5

////Arranged by @ClassicScott
//Strategy Created by @CheatCode1


strategy('ALMA/EMA Strategy', shorttitle='ALMA/EMA Strategy', overlay=true )


////Source Selection & ALMA Variables

//Dominant Momentum ALMA
dsource = input.source(close, title='Source', group='Dominant ALMA')
dperiod = input.int(title='Period', defval=130, group='Dominant ALMA')
doffset = input.float(title='Offset', step=0.025, defval=0.775, group='Dominant ALMA')
dsigma = input.float(title='Sigma', step=0.5, defval=4.5, group='Dominant ALMA')

dalma = ta.alma(dsource, dperiod, doffset, dsigma)

dalma_up_color = input.color(#66bb6a, 'Going Up!', group='Dominant ALMA', inline = '1')
dalma_down_color = input.color(#ef5350, 'Going Down :(', group='Dominant ALMA', inline = '1')
dcolor = close[1] > dalma ? dalma_up_color : dalma_down_color

////ALMA Plots
plot(dalma, color=dcolor, style=plot.style_stepline, linewidth=2, title='Dominant Momentum MA')


//Strategy by @CheatCode1 //Strategy by @CheatCode1 //Strategy by @CheatCode1 //Strategy by @CheatCode1 //Strategy by @CheatCode1 //Strategy by @CheatCode1 //Strategy by @CheatCode1 //Strategy by @CheatCode1 //Strategy by @CheatCode1 //Strategy by @CheatCode1 //Strategy by @CheatCode1 //Strategy by @CheatCode1

//Strategy by @CheatCode1 //Strategy by @CheatCode1 //Strategy by @CheatCode1 //Strategy by @CheatCode1 //Strategy by @CheatCode1 //Strategy by @CheatCode1 //Strategy by @CheatCode1 //Strategy by @CheatCode1 //Strategy by @CheatCode1 //Strategy by @CheatCode1 //Strategy by @CheatCode1 //Strategy by @CheatCode1

cheatcode = input.bool(true, '-----------CHEATC0DE1------------', group = 'Strategy Inputs', confirm = true)

//Variable Declerations/Plot Assingments

inp1 = input.int(49, 'Slow Ema Length', 1, 100, group = 'Strategy Inputs', confirm = true)
inp2 = input.int(9, 'Fast Ema Length', 1, 200, group = 'Strategy Inputs', confirm = true)
inp3 = int(200)
sma1 = ta.sma(close, inp3)
ema1 = ta.ema(close, inp1)
ema2 = ta.ema(close, inp2)

eplot1 = plot(ema1, 'Slow Ema', color.aqua, 1,  plot.style_linebr)
eplot2 = plot(ema2, 'Fast Ema', color.yellow, 1,  plot.style_linebr)
splot1 = plot(sma1, 'Long MA', close[1] < sma1 ? color.red:color.green, 1, plot.style_line, display = display.none)

cross1 = ta.crossover(ema1, ema2)
cross2 = ta.crossunder(ema1, ema2)

plotchar(cross1, '', '↑', location.belowbar,  close[1] > dalma and dalma > sma1 ? na:color.green, size = size.normal, editable = false)
plotchar(cross2, '', '↓', location.abovebar, close[1] < dalma and dalma < sma1 ? na:color.red, size = size.normal, editable = false)
bgcolor(cross1 and close[1] > dalma ? color.new(color.green, 80):cross2 and close[1] < dalma ? color.new(color.red, 80):na)

valueL = ta.valuewhen(cross1 and close[1] > dalma, close, 0)
valueS = ta.valuewhen(cross2 and close[1] < dalma, close, 0)

//Entries

if cross1 and close[2] > dalma[2] and close[1] > dalma[1]
    strategy.entry('Long', strategy.long)
if cross2 and close[2] < dalma[2] and close[1] < dalma[1]
    strategy.entry('Short', strategy.short)
    
//StochRsi
    
smoothK = input.int(3, "K", minval=1)
smoothD = input.int(15, "D", minval=1)
lengthRSI = input.int(14, "RSI Length", minval=1)
lengthStoch = input.int(8, "Stochastic Length", minval=1)
src = input(close, title="RSI Source")
rsi1 = ta.rsi(src, lengthRSI)
k = ta.sma(ta.stoch(rsi1, rsi1, rsi1, lengthStoch), smoothK)
d = ta.sma(k, smoothD)

//Cancellations

if k > 75
    strategy.cancel('Long')
if k < 25
    strategy.cancel('Short')
    
//Closures

if ta.crossunder(k, d) and k > 92
    strategy.close('Long')
if ta.crossover(k,d) and k < 8
    strategy.close('Short')

//Exit Percents

takeP = input.float(3, title='Take Profit', group = 'Take Profit and Stop Loss') / 100
stopL = input.float(5.49, title = 'Stop Loss', group = 'Take Profit and Stop Loss')/100
// Pre Directionality

Stop_L = strategy.position_avg_price * (1 - stopL)

Stop_S = strategy.position_avg_price * (1 + stopL)

Take_S= strategy.position_avg_price * (1 - takeP)

Take_L = strategy.position_avg_price * (1 + takeP)
     
     
//Post Excecution
if strategy.position_size > 0
    strategy.exit("Flat", limit=Take_L, stop = Stop_L)

if strategy.position_size < 0
    strategy.exit("Flat", limit=Take_S, stop = Stop_S)


More