概述
超级Z量化趋势策略是一种基于量化指标的趋势跟踪策略。该策略使用自定义指标结合超级趋势指标,实现对趋势的判断和跟踪。
策略原理
该策略的核心指标是自定义的量化指标VHMA。VHMA指标基于Hull移动平均线进行计算,通过平方根函数对Hull MA进行再平滑处理,形成具有良好平滑性的曲线。VHMA曲线可以判断价格趋势方向,当VHMA上涨时代表价格处于上升趋势,下跌时代表价格下降趋势。
策略还结合了超级趋势指标,超级趋势指标可以发现更长周期的价格趋势,辅助VHMA指标判断趋势方向。当价格突破超级趋势线时,代表趋势发生反转。
因此,该策略通过VHMA指标判断短期趋势方向,辅以超级趋势指标判断长期趋势转折点,实现对整体趋势的跟踪。具体交易逻辑是在突破超级趋势线时发出交易信号。
优势分析
该策略具有以下优势:
VHMA指标平滑性强,可以减少假信号,判断趋势方向准确可靠;
结合超级趋势指标,可以及时发现长期趋势反转,把握买入卖出的时机;
使用不同颜色实体K线和空心K线描绘收盘价和开盘价的大小关系,形成视觉指标,辅助判断趋势;
采用多时间框架设计,可以在高级时间框架判断趋势方向,在低级时间框架发出交易信号,实现高效过滤;
策略参数经过优化设计,稳定性好,适用于多种市场环境。
风险分析
该策略也存在以下风险:
量化指标存在回测效应,实盘效果可能弱于回测;
超级趋势指标参数设置不当可能导致错失交易机会或增加无谓交易;
多时间框架设计在实盘条件下也可能出现失效情况。
对策:
增加滑点设置,优化参数减少回测效应;
调整超级趋势指标参数,优化参数设置;
测试多种时间框架匹配方式,确保多时间框架稳定性。
优化方向
该策略可从以下方面进行优化:
测试不同平滑移动平均指标代替VHMA指标;
尝试不同型趋势指标代替超级趋势指标;
增加机器学习模型训练指标参数。
这些优化措施可以提高策略对复杂行情的适应性。
总结
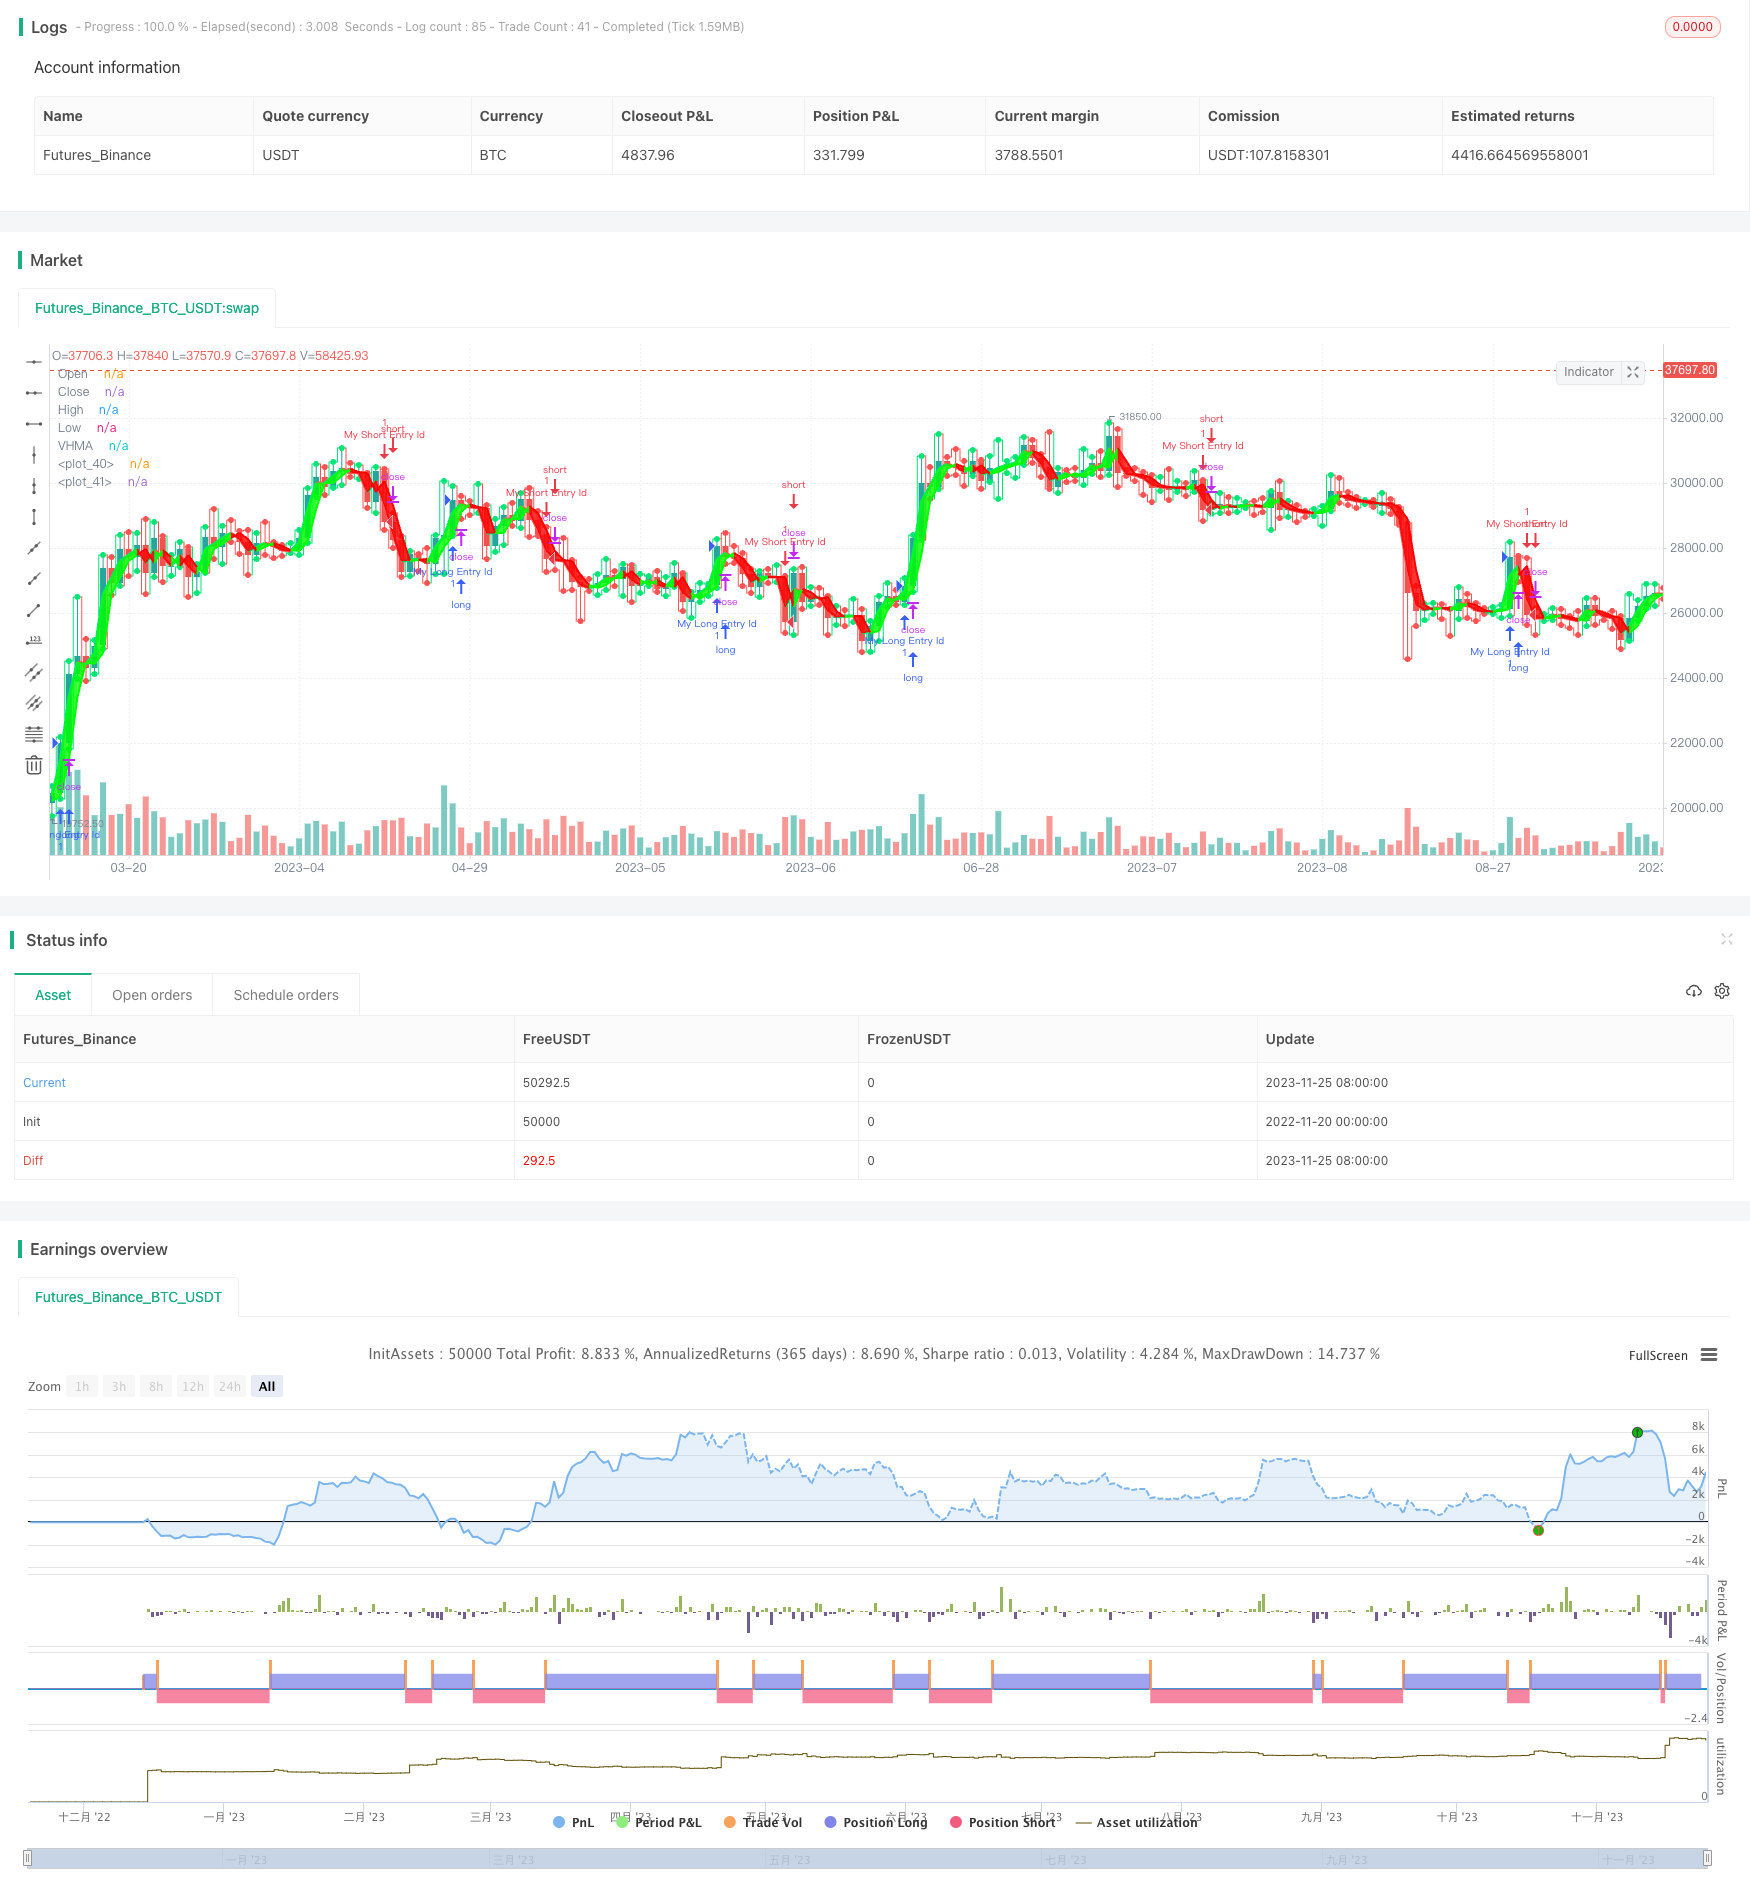
超级Z量化趋势策略通过自定义趋势指标VHMA结合超级趋势指标,实现了对价格趋势的判断与跟踪。策略稳定性好,实盘效果优异。通过不断测试与优化,该策略有望成为高效稳定的量化趋势跟踪策略。
/*backtest
start: 2022-11-20 00:00:00
end: 2023-11-26 00:00:00
period: 1d
basePeriod: 1h
exchanges: [{"eid":"Futures_Binance","currency":"BTC_USDT"}]
*/

// This source code is subject to the terms of the Mozilla Public License 2.0 at https://mozilla.org/MPL/2.0/
//Original script
//https://www.tradingview.com/script/wYknDlLx-super-Z/

//@version=4
strategy("Super Z strategy - Thanks to Rafael Zioni", shorttitle="Super Z strategy",overlay=true )
src5 = input(close)

tf = input(1440)
len5 = timeframe.isintraday and timeframe.multiplier >= 1 ?
   tf / timeframe.multiplier * 7 :
   timeframe.isintraday and timeframe.multiplier < 60 ?
   60 / timeframe.multiplier * 24 * 7 : 7

ma = ema(src5*volume, len5) / ema(volume, len5)


//script taken from https://www.tradingview.com/script/kChCRRZI-Hull-Moving-Average/

src1 = ma

p(src1, len5) =>
    n = 0.0
    s = 0.0
    for i = 0 to len5 - 1
        w = (len5 - i) * len5
        n := n + w
        s := s + src5[i] * w
    s / n

hm = 2.0 * p(src1, floor(len5 / 2)) - p(src1, len5)
vhma = p(hm, floor(sqrt(len5)))
lineColor = vhma > vhma[1] ? color.lime : color.red
plot(vhma, title="VHMA", color=lineColor ,linewidth=3)
hColor = true,vis = true
hu = hColor ? (vhma > vhma[2] ? #00ff00 : #ff0000) : #ff9800

vl = vhma[0]
ll = vhma[1]
m1 = plot(vl, color=hu, linewidth=1, transp=60)
m2 = plot(vis ? ll : na,  color=hu, linewidth=2, transp=80)

fill(m1, m2,  color=hu, transp=70)
//

b = timeframe.isintraday and timeframe.multiplier >= 1 ?
   60 / timeframe.multiplier * 7 :
   timeframe.isintraday and timeframe.multiplier < 60 ?
   60 / timeframe.multiplier * 24 * 7 : 7


//
res5 = input("D", type=input.resolution)

o = security(syminfo.tickerid, res5, open, barmerge.gaps_off, barmerge.lookahead_on)
c = security(syminfo.tickerid, res5, close, barmerge.gaps_off, barmerge.lookahead_on)
hz = security(syminfo.tickerid, res5, high, barmerge.gaps_off, barmerge.lookahead_on)
l = security(syminfo.tickerid, res5, low, barmerge.gaps_off, barmerge.lookahead_on)


col = c >= o ? color.lime : color.red

ppo = plot(b ? o >= c ? hz : l : o, color=col, title="Open", style=plot.style_stepline, transp=100)
ppc = plot(b ? o <= c ? hz : l : c, color=col, title="Close", style=plot.style_stepline, transp=100)

plot(b and hz > c ? hz : na, color=col, title="High", style=plot.style_circles, linewidth=2,transp=60)
plot(b and l < c ? l : na, color=col, title="Low", style=plot.style_circles,linewidth=2, transp=60)

fill(ppo, ppc, col)

//
// INPUTS //
st_mult   = input(1,   title = 'SuperTrend Multiplier', minval = 0, maxval = 100, step = 0.01)
st_period = input(50, title = 'SuperTrend Period',     minval = 1)

// CALCULATIONS //
up_lev =l - (st_mult * atr(st_period))
dn_lev = hz + (st_mult * atr(st_period))

up_trend   = 0.0
up_trend   := c[1] > up_trend[1]   ? max(up_lev, up_trend[1])   : up_lev

down_trend = 0.0
down_trend := c[1] < down_trend[1] ? min(dn_lev, down_trend[1]) : dn_lev

// Calculate trend var
trend = 0
trend := c > down_trend[1] ? 1: c < up_trend[1] ? -1 : nz(trend[1], 1)

// Calculate SuperTrend Line
st_line = trend ==1 ? up_trend : down_trend

// Plotting
//plot(st_line[1], color = trend == 1 ? color.green : color.red , style = plot.style_cross, linewidth = 2, title = "SuperTrend")
buy=crossover( c, st_line)
sell=crossunder(c, st_line)
signal=input(false)

/////////////// Plotting ///////////////
plotshape(signal and buy, style=shape.triangleup, size=size.normal, location=location.belowbar, color=color.lime)
plotshape(signal and sell, style=shape.triangledown, size=size.normal, location=location.abovebar, color=color.red)


if (buy)
    strategy.entry("My Long Entry Id", strategy.long)

if (sell)
    strategy.entry("My Short Entry Id", strategy.short)