RSI Momentum Aggregation Strategy

Overview
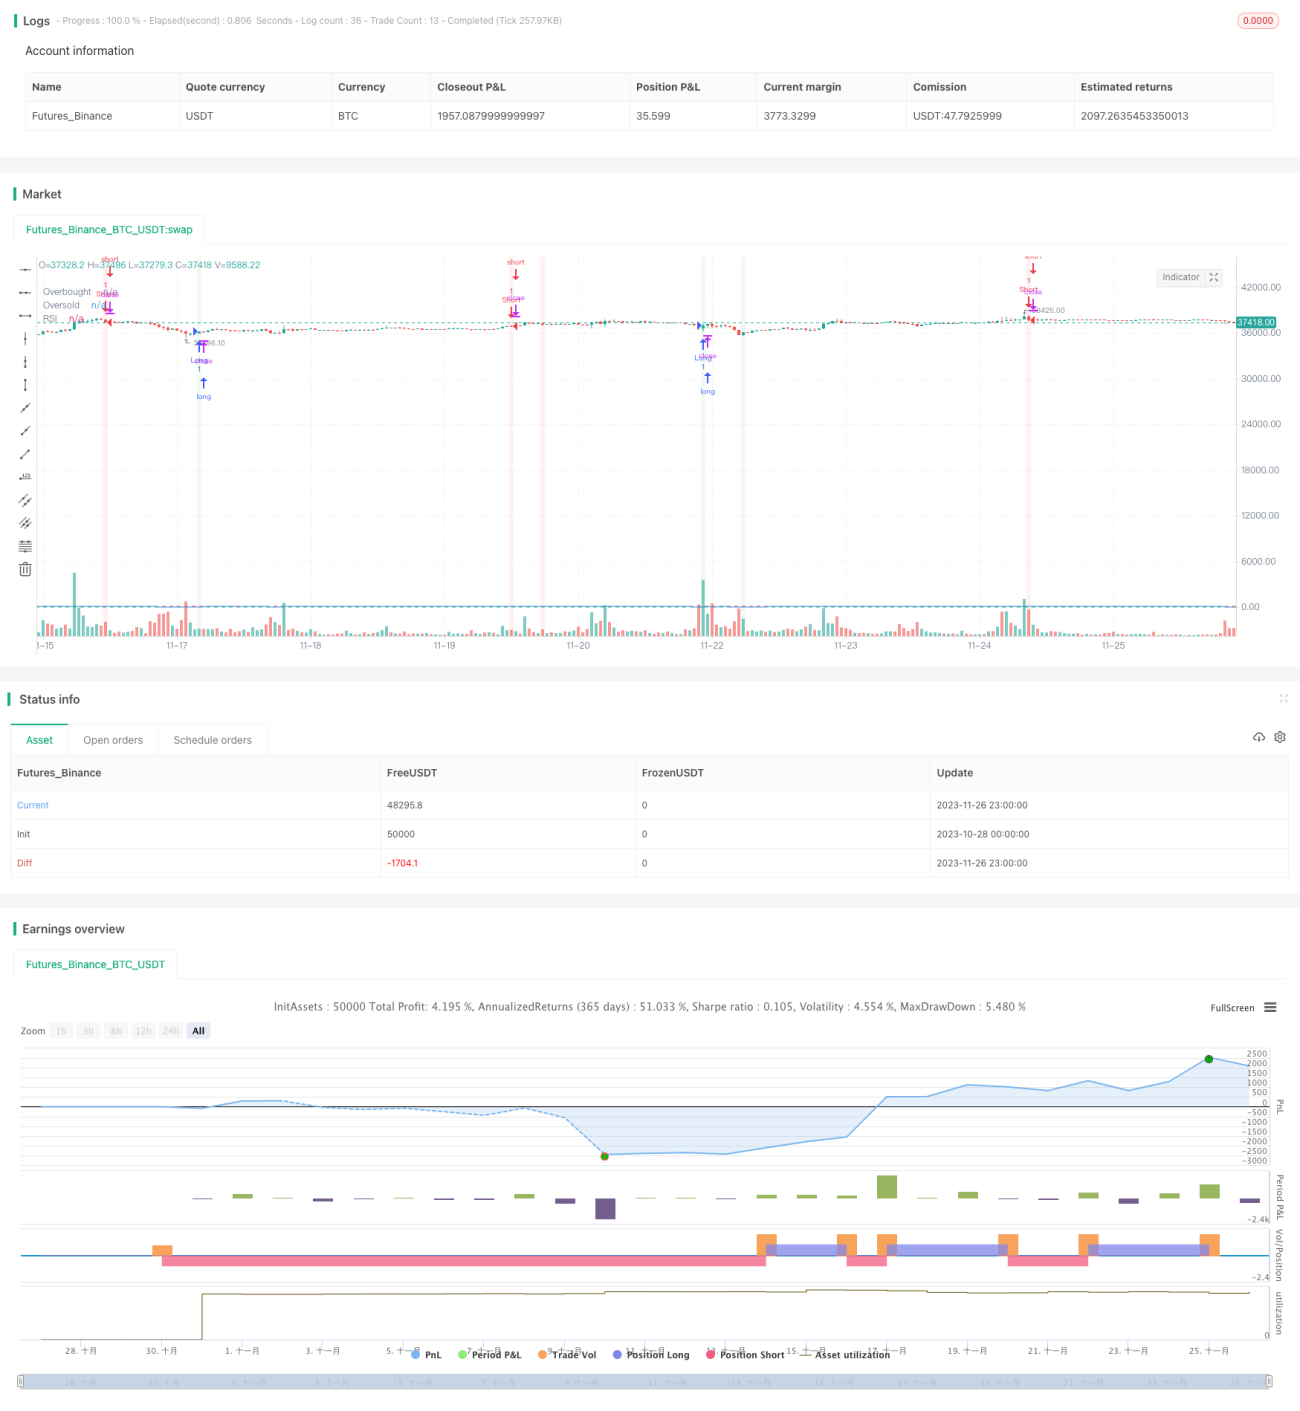
This article provides a detailed analysis of a cryptocurrency trading strategy based on the RSI indicator. The strategy uses the RSI indicator to determine market sentiment swings and implements buying low and selling high. Specifically, a buy signal is generated when the RSI indicator crosses above the 30 oversold line, and a sell signal is generated when it crosses below the 70 overbought line.
Strategy Principle
The core indicator of this strategy is RSI, the Relative Strength Index. The RSI indicator is based on the rise and fall of the price of a stock over a period of time to determine if the stock is overbought or oversold. RSI values range from 0 to 100. An RSI reading above 70 is considered overbought while below 30 is oversold.
The core logic of the strategy is to generate a buy signal when the RSI breaks out above 30 from the oversold region and generate a sell signal when the RSI breaks down below 70 from the overbought region. This allows entering the market at reversal points of excessive pessimism and optimism, thus achieving buying low and selling high.
Specifically in the code, the ta.crossover and ta.crossunder indicator functions are used to detect when the RSI crosses over or under the 30/70 boundary lines to trigger trade signals.
Advantage Analysis
This type of momentum strategy based on RSI signals has the following main advantages:
- Simple to understand and implement
- RSI is a reliable and widely used indicator
- Captures turning points in market sentiment for low buy/high sell
- RSI parameters can be tuned for different market cycles
- Can be combined with other filters to improve robustness
In summary, this strategy offers multiple advantages such as simplicity, authoritative indicator, catches market turns, tunable parameters, etc. This makes it a recommended basic quantitative strategy.
Risk Analysis
Of course, there are some risks to be aware of with this strategy:
- Prone to bull and bear traps
- Cannot effectively filter out false breaks in choppy markets
- Vulnerable to arbitrage by high-frequency traders
- Improper RSI parameters may miss trends or over-trade
- Single indicator more susceptible to manipulation
To address these risks, some improvements can be made:
- Add ATR stop loss/take profit to control loss per trade
- Add MA indicator for trend filter to avoid counter-trend trades
- Use time or tick filter for entry and exit
- Fine-tune RSI parameters or dynamic optimization
- Combine multiple indicators for robust signal confirmation
Optimization Directions
There is ample room for optimization with this RSI strategy:
- Employ adaptive RSI parameters for different market conditions
- Incorporate trailing stop loss/profit take techniques
- Use neural networks to judge signal reliability, filtering false signals
- Ensemble model voting for improved stability
- Apply deep learning for feature extraction and model-free strategies
- Incorporate high-frequency data and sentiment analysis to optimize entries
- Utilize reinforcement learning to train RSI parameters and stop loss/take profit
As can be seen from the analysis, there is tremendous potential to enhance this RSI-based strategy leveraging machine learning and deep learning techniques for better performance and stability going forward.
Conclusion
In summary, this article provides an in-depth analysis of a typical RSI indicator-based cryptocurrency trading strategy. From examining the pros, cons and optimization paths, this strategy offers a simple yet practical approach. There is ample room for extensions such as parameter tuning, stop loss/take profit, indicator combos. Going forward, advanced AI techniques can be employed for continual improvements. Overall, this is a recommended foundational quantitative strategy.
- 1